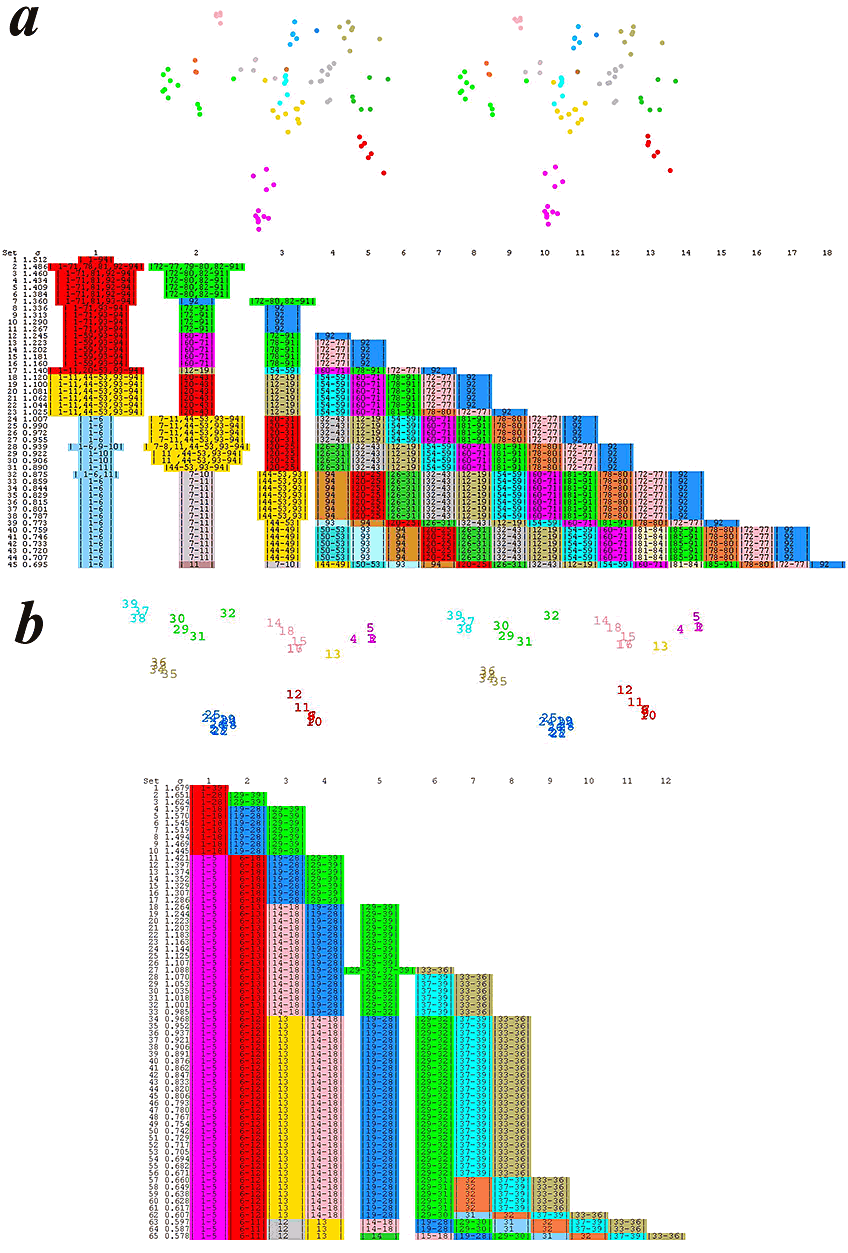
Euclidian space mapping and grouping of protein families:
Euclidian space mapping and grouping of protein families
(a) Sm proteins. The multiple sequence alignment was taken from (Wicker et al., 2001).
The sequences are numbered as follows: 1. ySmE; 2. riSmEa; 3. riSmEb; 4. arSmE; 5. huSmE;
6. caSmE; 7. huLsm5; 8. q9vrt7; 9. yLsm5; 10. o42978; 11. globu2; 12. huSmN; 13. oSmB;
14. chSmB; 15. dSmB; 16. caSmB; 17. arSmB; 18. ySmB; 19. sSmB; 20. riLsm1; 21. huLsm1;
22. yLsm1; 23. q20229; 24. yb18-schpo; 25. aaf46688; 26. aad56232; 27. aaf47567; 28. riSmx9;
29. aaf23841; 30. o74483; 31. ySmx13; 32. riSmGa; 33. riSmGb; 34. arSmG; 35. alSmG;
36. huSmG; 37. caSmG; 38. ySmG; 39. sSmG; 40. bLsm7; 41. riLsm7; 42. huLsm7; 43. yLsm7;
44. sulfo; 45. globu1; 46. pyroc1; 47. p-abys; 48. metha1; 49. aero-pern1; 50. riLsm3;
51. huLsm3; 52. q9y7m4; 53. yLsm3; 54. huSmD2; 55. caSmD2; 56. arSmD2; 57. sSmD2;
58. ySmD2; 59. pfalSmD; 60. huSmF; 61. dSmF; 62. riSmF; 63. bSmF; 64. caSmF; 65. ySmF;
66. arSmF; 67. sSmF; 68. nLsm6; 69. huLsm6; 70. yLsm6; 71. cab54975; 72. ySmD1;
73. sSmD1; 74. huSmD1; 75. riSmD1a; 76. arSmD1; 77. caSmD1; 78. yLsm2; 79. mLsm2;
80. amphSm; 81. yLsm4; 82. caLsm4; 83. huLsm4; 84. arLsm4; 85. ySmD3; 86. sSmD3;
87. arSmD3; 88. riSmD3; 89. huSmD3; 90. dSmD3; 91. caSmD3; 92. yLsm9; 93. aero-pern2;
94. m-therm2. (b) γ-Glultamylcysteine synthetase/glutamine synthase family proteins (γ-GCS/GS).
The multiple sequence alignment was taken from (Abbott et al., 2001). The sequence are numbered
as follows: 1. 4557625; 2. 7290879; 3. 7500706; 4. 312704; 5. 1439564; 6. 1170034; 7. 3913792;
8. 11386873; 9. 11282603; 10. 6580772; 11. 7478107; 12. 6562892; 13. 11499888; 14. 6831717;
15. 11349463; 16. 2495565; 17. 8246826; 18. 10580902; 19. 11272160; 20. 121661; 21. 11386815;
22. 11348607; 23. 6634496; 24. RVK00642; 25. RAB01613; 26. REF02644; 27. REFA03339;
28. RMN01341; 29. 9256961; 30. 11498554; 31. 6624705; 32. 7478087; 33. 4504027;
34. 7292645; 35. 6325292; 36. 1835156; 37. 1075624; 38. 7471952; 39. 121358.
The three dimensional projection of the multidimensional Euclidian space is
shown on top of each panel. Proteins are shown as circles in (a) and as numbers
in (b). Groupings at different steps defined by different σ-values are shown at
the bottom of each panel. The grouping on the projections corresponds to the most
stable configuration: sets 33-38 in (a) and sets 34-56 in (b). Colors of groups
are the same in the projection and in the table.
Abbott, J. J., Pei, J., Ford, J. L., Qi, Y., Grishin, V. N., Pitcher,
L. A., Phillips, M. A. & Grishin, N. V. (2001). Structure Prediction and Active
Site Analysis of the Metal Binding Determinants in gamma-Glutamylcysteine Synthetase.
J Biol Chem 276, 42099-42107.
Wicker, N., Perrin, G. R., Thierry, J. C. & Poch, O. (2001).
Secator: a program for inferring protein subfamilies from phylogenetic trees.
Mol Biol Evol 18, 1435-1441.