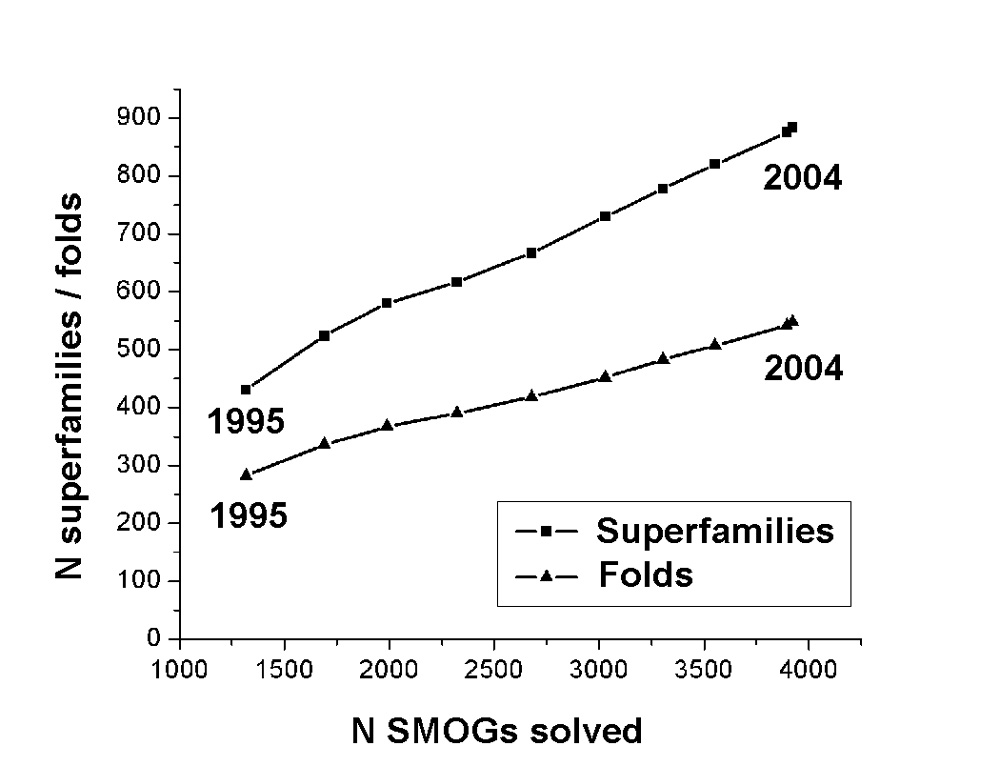
Growth in the number of superfamilies and folds with solved 3D structure: Growth rate remains approximately linear in time, despite the exponential growth in the number of solved structures. Each point represents a year. X axis, number of sequence-based clusters of protein domains with known 3D structure. Y axis, number of known structure-based domain superfamilies and folds as defined by SCOP database.