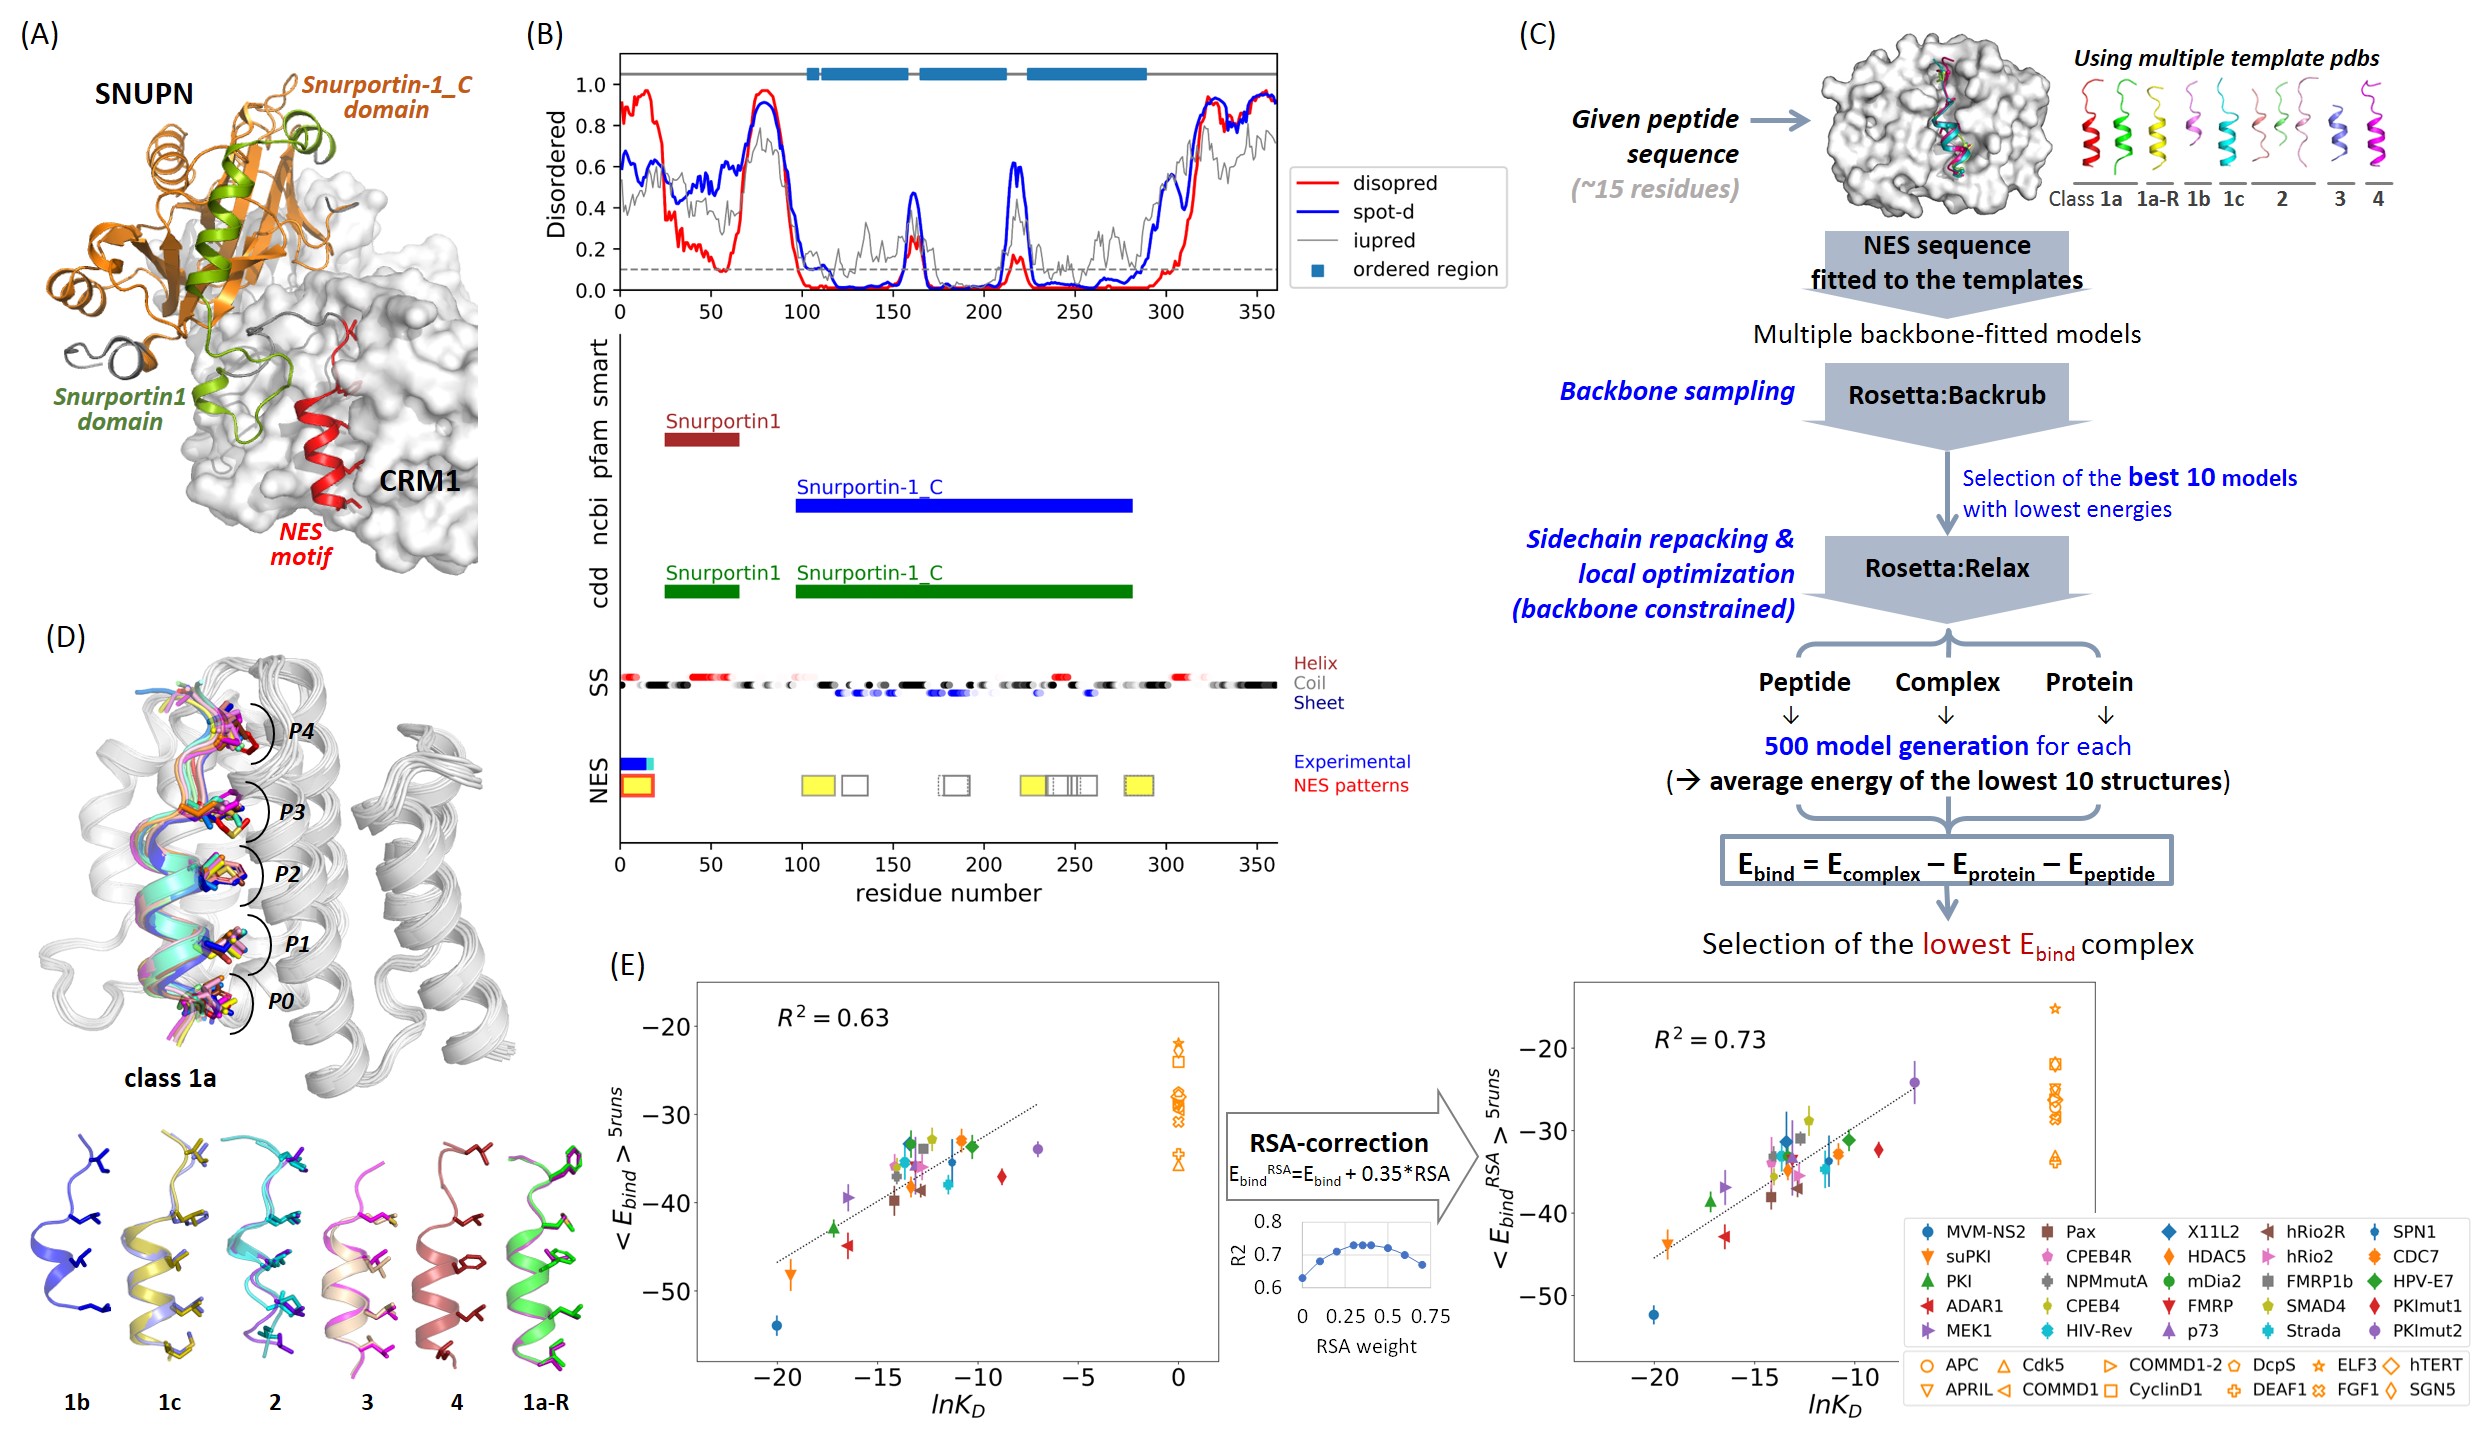
Structure-based prediction of NES motifs. (A) The crystal structure of CRM1-SNUPN complex structure (3GB8.pdb). The validated NES motif, Snurportin1 domain, and Snurportin-1_C domain are colored in red, green, and orange, respectively. CRM1 is represented by a white surface. (B) Disordered propensity, conserved domain information, predicted secondary structure (SS), and the location of the consensus patterns are plotted together. The defined ordered region is represented by the sky-blue box at the top. The regions of the conserved domains annotated in smart, Pfam, NCBI-curated, and CDD are marked in the middle. The predicted SS were colored by red, black, and blue for α-helix, coil, and β-strand, respectively. The gradient of the color corresponds to the confidence level of the prediction. For the NES regions, experimentally validated regions are displayed in blue (with mutation data annotated in NESdb) and cyan (annotated as a functional sequence in NESdb or as a site in validNES). All the consensus pattern matching segments are located at the bottom. Segments not in the ordered regions and without β-strand predictions in the middle are highlighted in yellow. The red boxes are the pattern-matching segments overlapping with experimental evidence. (C) CRM1-NES peptide complex model generation and the binding energy (Ebind) calculation procedure. (D) Generated models for the complex structures of CRM1-NES peptides with the lowest Ebind. (E) Correlation between the Ebind scores and the experimental KD values. The binding scores are averaged in the five independent runs (<Ebind>5runs; <EbindRSA>5runs for the scores corrected by residue solvent accessibility (RSA)) and compared to the logarithm of KD values (lnKD). The CRM1-binders with KD values are shown in filled markers with error bars, which are the standard deviation during the five runs. The false positives are shown in empty orange markers. In the middle, the correlation between R2 and the weights for RSA during the Ebind correction is shown.