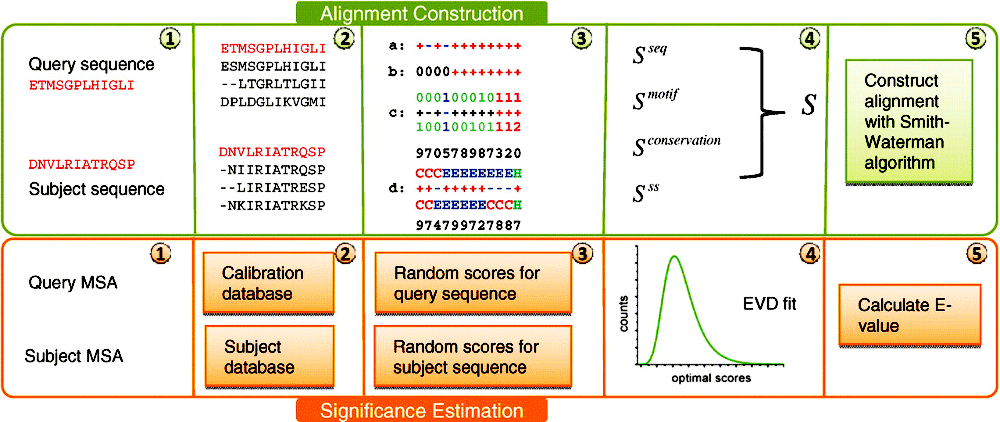
PROCAIN flowchart for construction of sequence alignments (green) and estimation of their statistical significance (orange). For the two compared multiple sequence alignments (MSAs), scores between individual positions are calculated by combining the standard measure for the similarity of residue content in the alignment columns (step 3a) with the motif (3b), conservation (3c) and secondary structure (3d) terms. The resulting scores for positional matches are used to construct the optimal local alignment by Smith-Waterman algorithm. To estimate the statistical significance of the optimal alignment score, we perform comparisons to unrelated profiles for both the query and subject MSAs. The query is compared to the calibration database, whereas the subject is compared to unrelated profiles in the searching database. The combined distribution of the resulting random scores is approximated with extreme value distribution (EVD) and used to calculate E-value.