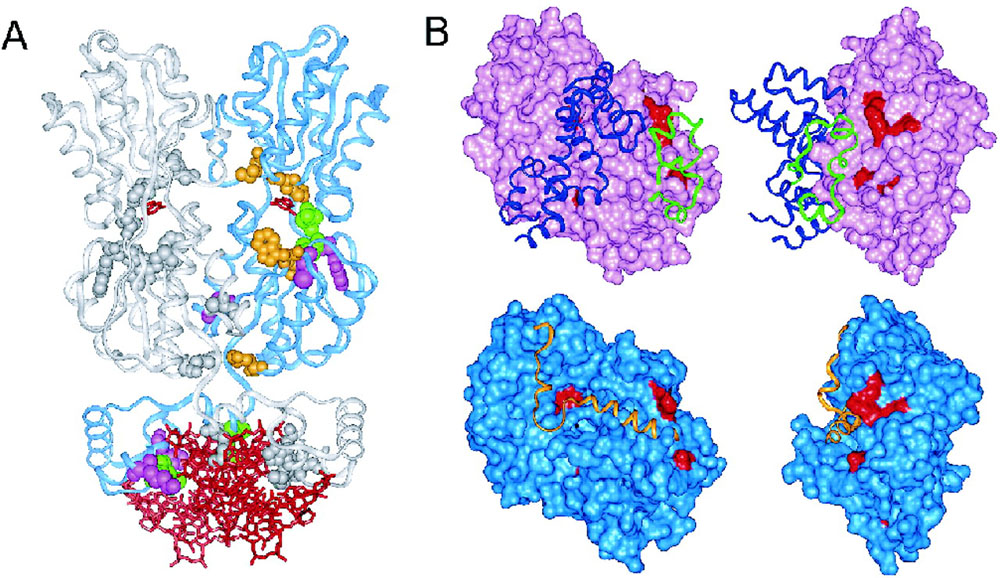
SPEL predictions mapped on 3D structure. (A) Mapping the top 10 predicted functional specificity determinants by SPEL and MI (mutual information method) to the protein structure of PurR (PDB ID: 1wet). Two chains of the PurR dimer are illustrated as ribbons (blue and gray). The ligands (small molecule guanine and DNA) are shown as red sticks. The specificity determinants mapped to one chain of the dimer is colored as follows: predicted by SPEL only (pink CPK), predicted by MI only (orange CPK), or predicted by both (green CPK). The specificity determinants mapped to the other chain are in gray CPK representation. (B) Connolly surface renderings of G protein alpha subunits. The upper two structures show the model of G protein alpha subunit (pink surface) bound to RGS (blue ribbon) and PDE (green ribbon) created from PDB ID 1fqj structure. The lower two structures show G-protein α-subunit (light blue surface) bound to GoLoco motif (orange ribbon) created from PDB ID 1kjy structure. The right view is generated by rotating protein structure 90° around the y-axis from the left view. Predicted specificity determinants are colored red. The figure is generated by Insight II package (Accelrys Software Inc.).