Compact Structure Patterns in Proteins
Introduction: Globular proteins typically fold into tightly packed arrays of regular secondary structures. We developed a model to approximate compact parallel and antiparallel arrangement of α-helices and β-strands, enumerated all possible topologies formed by up to five secondary structural elements (SSEs), searched for their occurrence in spatial structures of proteins and documented their frequencies of occurrence in the PDB. The enumeration model grows larger super-secondary structure patterns (SSPs) by combining pairs of smaller patterns, a process which approximates a potential path of protein fold evolution. The most prevalent SSPs are typically present in superfolds such as the Rossmann-like fold, the ferredoxin-like fold and the Greek key motif, whereas the less frequent SSPs often possess split β-sheets, left-handed connections and crossing loops. This novel model allows us to discover theoretically possible SSPs that are absent in the PDB. The search of the structure patterns (SSPs) demonstrates that the SSPs cover the majority of existing protein structures, where 99% of pdbs have at least half of the SSEs matched by SSPs with two elements and 72% of the pdb have at least half of the SSEs matched by SSPs with five elements. We investigated the distributions of SSPs presenting in SCOP superfamilies, which show that the superfolds such as Rossmann-like fold, ferredoxin-like fold and Greek-key motif are made of more frequent SSPs. In contrast, the rare SSPs often possess uncommon structure features such as split b-sheet, left-handed connection and crossing loops. All SSPs with up to four SSEs occurred in proteins. However, among SSPs with five SSEs, approximately 20% (218) are absent from existing folds. Of these unobserved SSPs, 71% (155) have unpaired β-strand(s) while 29% (63) lack unpaired β-strand(s) where 49 SSPs have two or more unfavorable features and 14 SSPs have one unfavorable feature. These 14 SSPs are of interest because many other SSPs with a single unfavorable feature are seen in the PDB. The objectives of our SSP enumeration and search include facilitation of: the protein engineering and design; and protein structure classification.
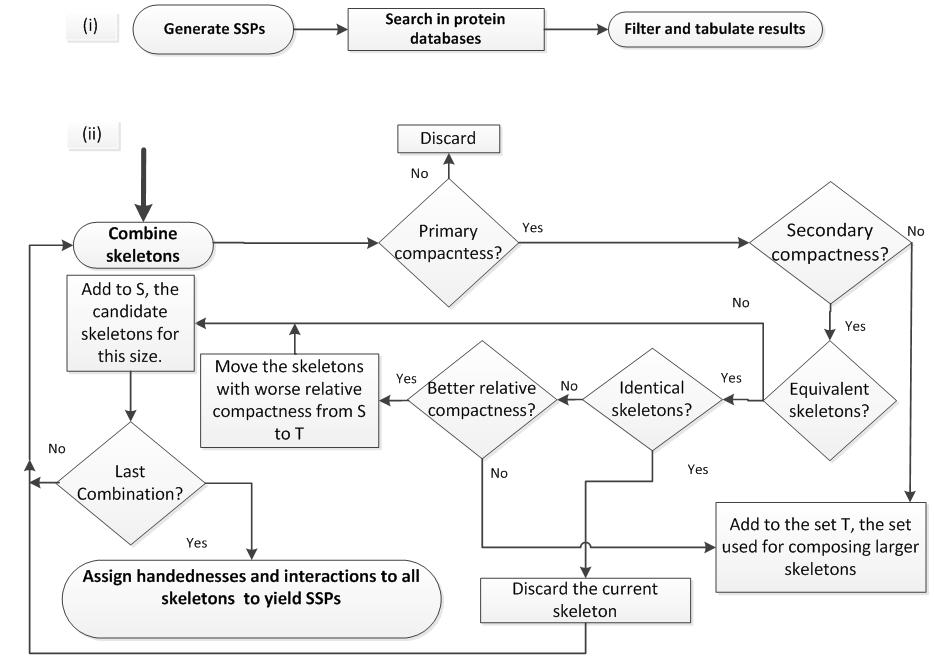
Overview of the methods: Our method is composed of three steps. (a) SSP generation, (b) search for SSPs with ProSMoS, and (c) comparison between the observed frequency and the expected frequency. In brief, we modeled topologies using a lattice model, where a generic SSE, i.e. either a β-strand or an α-helix, was represented as a directed node on a hexagonal grid. The obtained topologies are called skeletons. We retained only compact skeletons that respect our definition of compactness. Assignment of SSE type to each skeleton node and specification of interactions between every pair of SSEs yielded the set of SSPs. Example lattice and the flowchart of our SSP generation method are shown below.

Each SSP in the set was represented by a 2D query matrix that was supplied to ProSMoS to search against a set of meta-matrices representing structures in the PDB. The sub-matrix of a protein structure that exactly matched the query matrix was returned as a motif hit. Using structure ranges corresponding to the sub-matrix match, we assigned the motif hits to SCOP superfamilies (within the first 7 classes). Each superfamily assignment was called superfamily hit. A SCOP superfamily can be counted only once as a hit for each SSP. We computed observed motif frequencies based on the counts of motif hits and observed superfamily frequencies based on the counts of superfamily hits. For calculation of observed superfamily frequency, we sought to limit the definition of superfamily to the SSEs present in the conserved structure core. Therefore, we only counted superfamily hits if the query SSP was present in at least half of superfamily pdbs. We call such counted superfamilies "core superfamilies". A random model was developed to obtain the expected frequency of SSP occurrences, which corresponds to the number of ways that a query SSP can be generated by assembling smaller SSPs. We compared observed frequencies with expected frequencies to reveal overrepresented and underrepresented SSPs.
Each SSP in the set was represented by a 2D query matrix that was supplied to ProSMoS to search against a set of meta-matrices representing structures in the PDB. The sub-matrix of a protein structure that exactly matched the query matrix was returned as a motif hit. Depending on the position of the motif hits, we assigned the motif hits to SCOP superfamilies (within the first 7 classes). Each superfamily assignment was called superfamily hit. A SCOP superfamily can be counted only once as a hit for each SSP. We computed observed motif frequencies based on the counts of motif hits and observed superfamily frequencies based on the counts of superfamily hits. We sought to limit the definition of superfamily to the SSEs present in the conserved structure core of the superfamily, in the context of observed superfamily frequency. To achieve this, we only counted superfamily hits if the query SSP was present in at least 50% of proteins of the superfamily. We call such counted superfamilies “core superfamilies”. The same criterion is used for the domain hits. For a given SSP in Sn, the observed superfamily frequency was calculated by dividing the number of superfamily hits of the given SSP by the total number of counted superfamilies found by all SSPs in Sn. In order to compare motif frequency with superfamily frequency fairly, the motif frequency for an SSP in Sn was calculated by dividing the number of SSP motif hits in the counted superfamilies by the total number of motif hits in the counted superfamilies for all SSPs in Sn. A statistical model was developed to obtain the expected frequency of SSP occurrences, which corresponds to the number of ways that a query SSP can be generated by assembling smaller SSPs. We compared observed frequencies with expected frequencies to reveal overrepresented and underrepresented SSPs.
Pattern search and the coverage: We generated all possible compact SSPs containing up to five SSEs, with the number of resulting SSPs growing from 5 (S2) to 1239 (S5) (see table below).
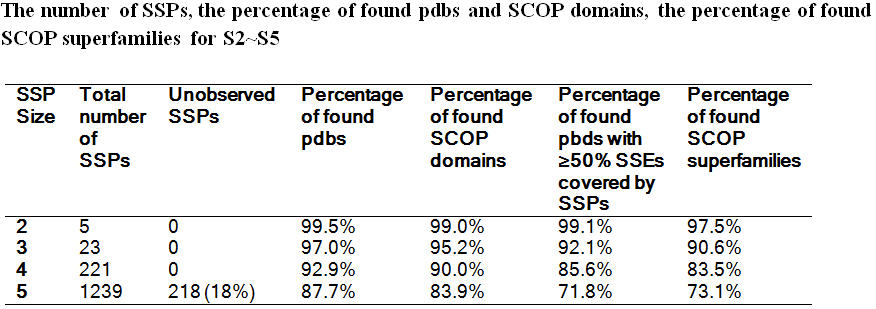
Each generated SSP in S1-S4 has at least one motif hit in the PDB. However, 228 SSPs of S5 (18%) are absent from the PDB (see Unobserved SSPs section). For each set of SSPs, we counted the number of proteins identified by at least one SSP. The Table below shows that the generated SSPs cover a significant portion of the PDB (99.5%, 97.0%, 92.9%, 87.7% for S2-S5). However, a small percentage of proteins cannot be found by any SSP. For example, 2198 proteins that contain at least 3 SSEs were not covered by any S3 SSP (see Limitations section). A similar computation was performed on all SCOP domains in the first 7 classes to quantify the SSP presence in SCOP superfamilies.
The percentages of identified SCOP superfamilies (97.5%, 90.6%, 83.5%, 73.1% for S2-S5) is lower than the corresponding percentages of identified SCOP domains (99.0%, 95.2%, 90.0% and 83.9% for S2-S5). This discrepancy is due to the following reasons. First, only core superfamilies (defined in Methods) were considered when calculating the percentage of identified SCOP superfamilies. However, if we restrict the domain hits to the superfamily core, the percentage of identified domains decreases marginally to 98.9%, 93.5%, 85.5% and 72.2% for S2-S5. The remaining discrepancy is attributed to the uneven distribution of SCOP superfamily sizes. The superfamily counts are less redundant than their representative domains.
For each Sn, we computed the SSE coverage for proteins in the PDB, where the coverage is defined as the number of non-redundant SSEs matched by any SSP of a given Sn, divided by the total number of SSEs of the structure. Fig. 2 highlights the coverage distributions. For S2, a majority of SSEs in the PDB structures are covered (80% of the structures are covered by over 90% of SSPs); very few structures are uncovered. In fact, 99% of structures have at least half of the SSEs matched by S2 SSPs. For larger SSPs (S3-S5), the coverage is lower. For example, the percentage of all structures with at least half of their SSEs covered by some SSP in S5 (please see table below) is only 72.
When we move to larger motifs (S3-S5) the distributions shift towards lower coverage, and for S5 SSP matches, 72% of the structures have at least half of their SSEs matched (see table below).
The distribution of structure patterns: We first computed the distribution of helix and strand in the structure databases (click here to see the result), which demonstrated that the frequencies of α-helix and β-strand are not equal. We then analyzed the distribution of S2 SSPs (SSPs with two secondary structure elements including β-hairpin, α-hairpin, β-α, α-β and unpaired β strands), the result is available here. For the results of high order SSPs including S3, S4 and S5, please click the links below. The discussion of the distribution of SSPs is provided in the manuscript.
User guide: We tabulate the SSP search results online for S3, S4 and S5 in a table sortable by SSP identity, the numbers of motif hits and superfamily hits along with the corresponding observed and expected frequencies. The number of motif hits link will navigate the user to the individual page that displays detailed search results such as the SCOP domain id, range of each motif hit and the corresponding superfamily assignment. The motif hits can be visualized with PyMOL linked to the motif hit range.
Unobserved SSPs: Unlike previous studies where enumeration was limited to a certain subset of protein folds, our SSPs expand to all possible combinations of SSEs. Structural classification (CATH and SCOP) can be viewed as a summarization of SSPs present in nature, where the SSP relationships are established by structure comparison. However, studying SSPs in the opposite way, i.e., enumerating possible SSPs first and then examining their distribution in proteins can provide additional insight into protein folding rules govern SSP occurrence and thereby limit protein fold space. In particular, we will find SSPs that were not observed in protein structures. Our search found all SSPs from S1 to S4 to have at least one motif hit in the PDB. However, 218 S5 SSPs did not have any motif hit in the current PDB (unobserved SSPs). Among the unobserved SSPs, 155 have unpaired beta-strand(s) and are thereby not considered as isolated domains, since they require additional elements fold. Therefore, we focus on outlining the properties of the remaining 63 unobserved SSPs that could potentially serve as protein design targets. The diagrams of these SSPs are shown here.