Contents
I. Overview of Database
(a) PDB Files
(b) Structurally Conserved Regions (SCRs)
(c) Feature Set
(d) Position Specific Scoring Matrix (PSSM)
II. Overview of Prediction Method
(a) Input Format
(b) Program Options
(c) Output Format
Reference
Defining and predicting structurally conserved regions in protein superfamilies. Huang IK, Pei J, and Grishin NV. Bioinformatics. 2013 Jan 15;29(2):175-181
I. Overview of Database
The database of structurally conserved regions (SCRs) contains protein domains taken from 386 superfamilies defined by SCOP version 1.75. All-against-all DaliLite pairwise alignments
were generated for each protein to its superfamily members and for each position the fraction of aligned residues, or the structural conservation index (SCI), was calculated. A position
is considered structurally conserved when it is present in at least 80% of all SCOP superfamily members after alignment (SCI >= 0.8). Basic statistics from the database are displayed at
the top left corner and the list of superfamilies can be sorted by SCOP IDs, number of structures, and fraction of SCRs by clicking on the respective table header.
Clicking on the SCOP superfamily ID opens allows the user to see more information about the superfamily such as its lineage and domains.
All files corresponding to the protein domains can be downloaded from the URL:
http://prodata.swmed.edu/scr_prediction/database
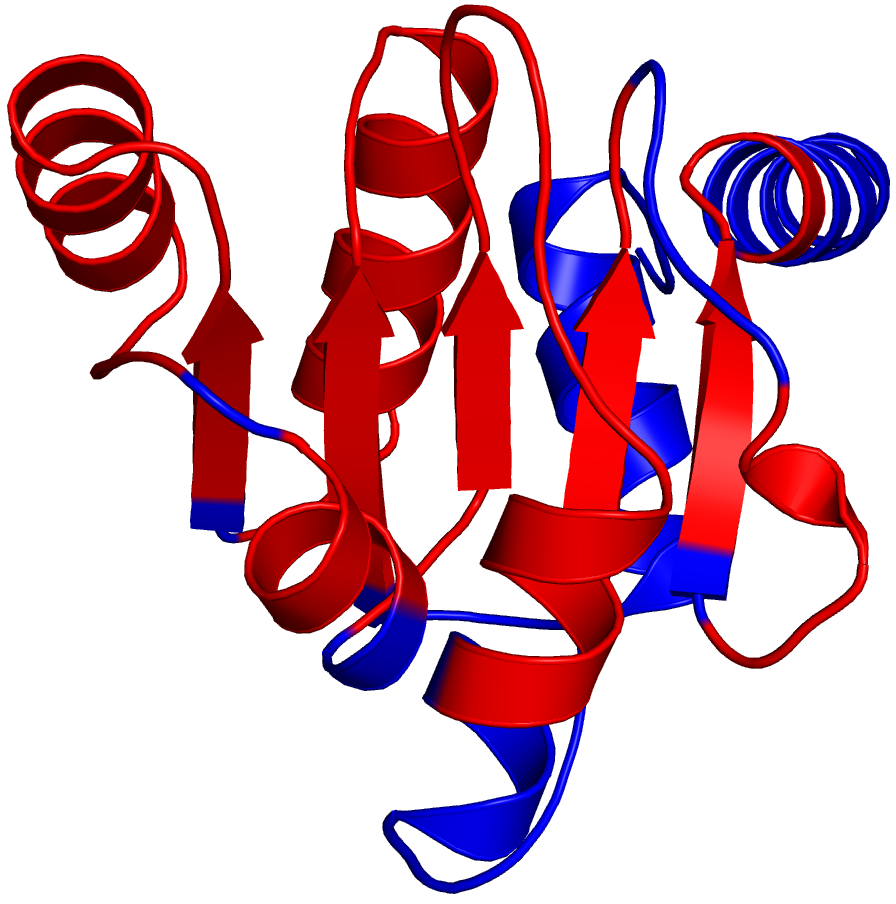
(a) PDB File
The PDB file is taken from the Protein Data Bank. It shows the structure for the specific protein domain with the b-factor column replaced with either a 0 if the SCI < 0.8 or a 1 if the
SCI >= 0.8. To view these results visually in Pymol, select the color by b-factors option from the side menu. The residues marked in red represent SCRs while the residues in blue
represent variable regions.
(b) Structurally Conserved Regions (SCRs)
Clicking on the this link shows all the pairwise alignments for the designated query protein, shown in bold and black, combined with the master slave algorithm. These alignments can
either be viewed with gapped regions in the query protein or in a concise form where the gaps are removed. Lowercase letters correspond to insertions determined by DaliLite. The color of
a residue corresponds to its DSSP secondary structure (H, E, C), and residues that are bolded and highlighted in yellow represent regions of the query protein that are structurally conserved. Every 10th residue of the query protein is marked
and integer values of SCIs, with an asterisk (*) denoting an SCI of 1, are displayed at the top.
Example of SCR alignments
(c) Feature Set
The feature set is a file that contains all the residue features (besides the PSSM) that were used in the neural network. The first line contains the protein sequence and the
remainder of the file is divided into columns based on different residue properties. The columns correspond to the following features:
# - Residue Number
L - Sequence Length
AA - Amino Acid
SS - Secondary Structure by DSSP
CB14 - Number of C-beta Residue Contacts in 14A Radius
SSP - PSIPRED Secondary Structure Predictions (C, H, E)
RSAP - RSA Prediction
PBL_CSV - AL2CO Sequence Conservation Values from PSIBLAST Homologs
PBL_FRC - Gap Fraction from PSIBLAST Homolog Alignments
SCI - SCI Generated from Pairwise DaliLite Alignments
(d) Position Specific Scoring Matrix (PSSM)
The PSSM corresponds to a matrix of dimension (N, 20) where N is the number of residues for a protein. It is calculated directly from the PSIBLAST algorithm with 4 iterations and e-value of 10^-4. Each column represents the frequency of amino acids (ordered alphabetically by their one letter code) in the PSIBLAST alignments.
II. Overview of Prediction Method
Given a single protein structure or sequence, it is possible to use neural networks to predict regions that are likely to be conserved. The program first generates a set of features, as described in Section 1(c) that can be used as inputs for the neural network. The Fast Artificial Neural Network library is then implemented to return predicted SCIs which can be used to delineate SCRs.
(a) Input Format
A single protein sequence or structure can be input into the prediction program. Only one method of input (sequence or structure) can be used, and the program options can be selected based on the input type.
Input sequence: The input sequence can either be uploaded as a file (.fasta, .fa, .seq, .faa) or input into the text field, and must be in the FASTA format. A sequence recorded in a FASTA format consists of a single-line description (sequence name), followed by line(s) of sequence data. The first character of the description line should be a greater-than (">") symbol. Only a single sequence is used and any additional sequences input into the file will be ignored by the program
FASTA format: In this example, only seq0 will be used for prediction
>seq0
FQTWEEFSRAAEKLYLADPMKVRVVLKYRHVDGNLCIKVTDDLVCLVYRTDQAQDVKKIEKF
>seq1
KYRTWEEFTRAAEKLYQADPMKVRVVLKYRHCDGNLCIKVTDDVVCLLYRTDQAQDVKKIEKFHSQLMRLME
LKVTDNKECLKFKTDQAQEAKKMEKLNNIFFTLM
>seq2
EEYQTWEEFARAAEKLYLTDPMKVRVVLKYRHCDGNLCMKVTDDAVCLQYKTDQAQDVKKVEKLHGK
>seq3
MYQVWEEFSRAVEKLYLTDPMKVRVVLKYRHCDGNLCIKVTDNSVCLQYKTDQAQDVK
Input structure: The uploaded structure file should be in PDB format. PDB ids can be specified instead of uploading structure files. The chain ids can also be specificed for the input structure files or pdb ids. If a chain id is not specified, only the first chain is used.
(b) Program Options
The selections allow you to use neural networks that have been trained on structural features, sequence features, or both. If a FASTA sequence is uploaded, only features from the
protein sequence can be applied whereas the input of a PDB structure allows any option to be selected. Sequence features are useful when no structure is available, structural features
are the most efficient in terms of speed, and using both sets of features optimizes prediction accuracy.
(c) Output Format
The prediction program returns two types of outputs. The colored output has the predicted SCI, as well as a sequence with the same formatting as described in the Section 1(b). In addition the output is displayed in a black and white with 5 columns corresponding to the residue number, PSIPRED predicted secondary structure, AA code, SCI, and an 'X' for a structurally conserved region.