Preparation of NMR Structures for Evaluation of CASP Models
We know that NMR structures are "bad"1). That said, can they be this bad?
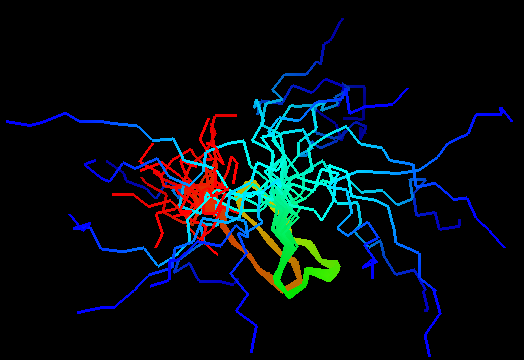
Jumping through 20 NMR models of T0480 (2k4x) reveals apparenty random placement of terminal segments. Equally floppy structures for other NMR targets can be seen here. It might happen that such properties of NMR model interfere with the assessment of models generated by predictors. Two considerations come to mind. First, it is desirable to keep as much of the NMR structure for evaluation as possible, since almost every residue carries some experimental information. Second, if position of a residue in NMR models appears random, this residue should not be used in evaluation to avoid penalizing predictions for possibly correct conformation contradicting random NMR models. Therefore we took the liberty to remove certain regions from NMR structures, but an attempt has been made to be very permissive about inclusion of residues in evaluation. An alternative, and possibly better approach would be to score predictions versus NMR restraints rather than in a traditional Cartesian coordinate comparison. We leave this to others. Our strategy consisted of the following steps.
First, for each structure, all (20 or 10) NMR models were superimposed with Theseus, a wonderful program by Doug Theobald and Deborah Wuttke 2) that uses Maximum Likelihood method for multiple structure alignment. As a result, variable regions do not disrupt the alignment of the conserved core, and the regions that can be superimposed well are tightly aligned. However, some NMR structures were too floppy to produce reasonable superpositions even with Theseus (T0480 and T0484). Really random regions were removed from these two structures prior to superposition and were placed back afterwards.
Second, for each Cα atom, its average position among 20 NMR models was found, and the average of distances squared from this position to equivalent Cα atoms in NMR models was computed. We term the square root of this quantity "standard deviation of atomic postions" (SD) in NMR models, AKA "root mean-square radial displacement". To reduce the effect of a single poor quality model, the Cα atom with the largest distance from the average position was removed, and both average and standard deviation were recalculated without this Cα atom. The resulting lists of SDs for each NMR target are here. The histogram of SDs combined for all targets reveals many very large deviations, some trailing to above 50Å (panel A below):
|
|
| A. Histogram showing all deviations | B. Histogram showing deviations up to 5Å, binned at 0.5Å |
|
|
| C. Histogram binned at 0.3Å | D. Histogram binned at 0.2Å |
|
|
| E. Histogram binned at 0.1Å | F. Histogram binned at 0.05Å |
We took a simplistic, and visual, approach to choosing the SD cutoff for the residue removal. Histograms of SD were made at several bin-widths, from larger to smaller. Large bins (0.5Å, panel B above) reveal a slight "dip" in counts between 3 and 3.5Å. This indicates a presence of the second component in this distribution, and hints that a reasonable cutoff can be somewhere around 3.5Å. Smaller bins size (0.3Å, panel C) suggets another "dip" (around 2.5Å) pointing to a third component with the mode between 2.5Å and 3Å. Finally, binning at 0.2Å (panel D) shows yet a third "dip" even closer to 0, between 1.5Å and 2Å. The values around 1.8Å, 2.5Å and 3.5Å might be chosen as possible SD cutoffs. Inspection of histograms for smaller bin sizes (E: 0.1Å and F: 0.05Å) supprots this notion and reveals that the histogram quickly becomes "discrete" around 3.5Å. It seems like 3.5Å is the most permissive cutoff suggested by the data.
3.5Å is a really generous cutoff value. Assuming three-dimensional uncorrelated Gaussian for atomic dispacements: Exp[-(x2+y2+z2)/(2σ2)]/(2π(2π)1/2σ3), SD2 in our defintion corresponds to 3 times the Gaussian variance σ2. Therefore SD=3.5Å gives us ~50% probability that the atom will be found within 3.1Å from the mean location, ~95% probability within 5.7Å radius, and ~99% probability for 6.8Å. And 6.8Å is a large random displacement for an atomic structure. For reference, B-factor of 100 in X-ray structures corresponds to an expected SD of 2Å (B=8π2/3 SD2), 60 for 1.5Å and 25 for 1.0Å. SD of 3.5Å would mean B-factor of ~320, which is considered very large. Therefore, with SD cutoff of 3.5Å we are not removing regions of NMR models that may be valuable for evaluation.
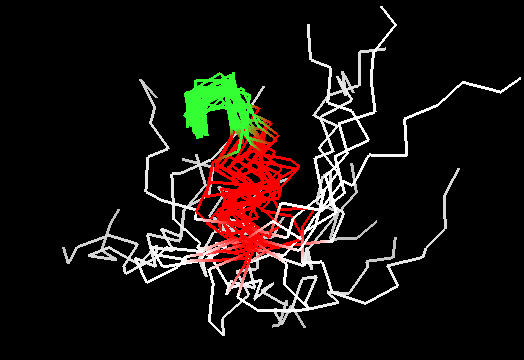
On the other hand, it does not look like this premissive inclusion adds many poorly structured residues to evaluation. First, the total number of residues with SD between 1.8 and 3.5Å is not very large (about 100, which is ~5% of the total). Second, inspection of these regions reveals resonable structure in them, for instance, residues colored red in this image of T0467 C-terminus (2k5q residues 83-105) have SD between 1.9 and 2.8Å. They are clearly structured as a helix, which moves around somewhat. Residues shown in white have SD>3.5Å, and vary in both conformation and location.
Third, residues with SDs for Cα atoms above 3.5Å were removed from NMR models, and remaining atoms were used in evaluation. The resulting NMR models, PyMOL scripts to show which atoms were removed, and related stuff can be found here.
Fourth, since NMR models show quite a bit of variabity between them even after removal of poorly defined residues (see the T0467 wagging tail above), all 20 NMR models were used to compute scores with prediction models, and the best score was selected to characterize this prediction. Because all NMR models are considered to be equally good (or bad?) representations of the actual structure, rationale behind this was if a prediction matches one NMR model well, this prediction should not be directly compared to a prediction that matches this NMR model poorly, but matches another NMR model better.
1) We respect titanic efforts of NMR spectroscopists and their willingness to contribute to CASP. NMR brings us many amazing structures and we understand that in the absence of distance constrains conformation is not defined. Please forgive our silly jokes.
2) Theobald DL & Wuttke DS (2006) "THESEUS: maximum likelihood superpositioning and analysis of macromolecular structures." Bioinformatics 22:2171-2172, PMID: 16777907