Whole chain vs. Domain in CASP
Traditionally, CASP targets are evaluated as domains, i.e. each target structure is parsed into domains, and model quality is computed for each domain separately. This strategy makes sense for two reasons:
- Domains can be mobile and their relative packing can be influenced by ligand presence, crystal packing for X-ray structures, or be semi-random in NMR structures. Thus even a perfect prediction algorithm will not be able to cope with this adequately, for instance in the absence of knowledge about the ligand presence or crystal symmetry.
- Predictions may be better or worse for individual domains than for their assembly. This happens when domains are of a different predictability, e.g. one has a close template, but the other one does not. Even if domains of a target are of equal prediction difficulty, it is possible that the mutual domain arrangement in the target structure, while predictable in principle, differs from the template, and thus is modeled incorrectly by predictors.
Comparison of the whole-chain evaluation with the domain-based evaluation dissects the problem of 'individual domain' vs. 'domain assembly' modeling and should help in development of prediction methods.
While it is clear that a detailed look at the predictions for each domain is beneficial, it is desirable to combine predictions over targets in a meaningful way, and to rank servers by the averaged ability to predict protein structures. Combination over whole chains does not address problems with domain predictions, but combination over domains may be dominated by multi-domain easy targets with domain arrangement matching the template and thus predicted well. Therefore it makes sense to combine whole chain and domain evaluations. In this combination, some targets, in particular those without problems of domain assembly, could be evaluated as 'whole chain'; while other targets, notably those with different domain predictability or difficulties with domain assembly, could be evaluated as 'domains'. Here, we attempted to determine a natural cutoff for whether the target should be evaluated as a 'domains' or as a 'whole chain'.
For each target composed of more than 1 domain (see our domain parse), we obtained GDT-TS scores on the whole chain and individual domains for all server models. Then weighted sum of GDT-TS scores for domain-based evaluation was computed, i.e. GDT-TS for each domain was multiplied by the domain length, summed, and the sum was divided by the sum of domain lengths. Typical correlation plot between the two GDT-TSs (whole chain and weighted by the number of residues sum of GDT-TS scores for domain-based evaluation) looked like this:
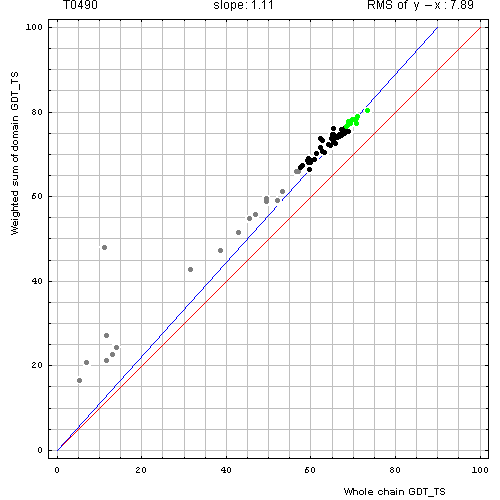
Correlation between weighted by the number of residues sum of GDT-TS scores for domain-based
evaluation (y, vertical axis)
and whole chain GDT-TS (x, horizontal axis).
Each point represents first server model. Green, gray and black points are top 10, bottom 25% and the rest of prediction models. Blue line is the best-fit slope line (intersection 0) to the top 10 server models. Red line is the diagonal. Slope and root mean square y-x distance for the top 10 models (average difference between the weighted sum of domain GDT-TS scores and the whole chain GDT-TS score) are shown above the plot.
The points lie above the diagonal. Apparently, weighted sum of domain predictions is higher than the whole chain GDT-TS. This is because domain arrangement is a bit different between target and template, thus, while individual domains are modeled well, their assembly is predicted worse. We measure the difference between the weighted sum and the whole chain GDT-TS by two parameters. The root mean square (RMS) difference between the weighted sum of GDT_TS on domains and GDT_TS on the whole chain (RMS of y−x) measures absolute GDT-TS difference. A slope of best-fit line with intercept set to 0 (slope) measures relative GDT-TS difference. These parameters are computed on top 10 (according to the weighted sum) predictions.
The target on the above plot (T0490) is a four-domain protein. The slope and the RMS of y−x are 1.1 and 7.8, respectively. Do these parameters justify splitting the target into 4 domains and using all the domain individually in the combined evaluation of predictions? To answer this question, we examined correlation plots for all targets.
Here, we illustrate two extreme examples. First, for T0504, which is a triplication (3 domains) of SH3-like barrel, the plot revealed that while individual domains are predicted reasonably well: GDT-TS above 60 for some servers, their packing was not: GDT-TS about 20, which is 3 times less than the weighted sum over 3 domains, thus indicating that domain arrangement was modeled randomly by the servers and did not match closely the target domain arrangement. Obviously, domain evaluation is beneficial for this target.
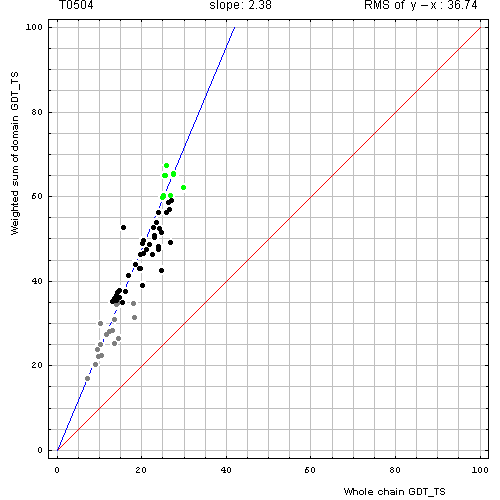
Correlation between weighted by the number of residues sum of GDT-TS scores for domain-based
evaluation (y, vertical axis)
and whole chain GDT-TS (x, horizontal axis).
Second, for T0447, which is also a 3-domain target, the plot revealed that weighted sum and whole chain GDT-TS are about the same for all servers, and for all template-based servers cluster near 90% GDT-TS. Clearly, domain-based evaluation is not different from the whole chain evaluation and does not reveal any interesting features of predictions.
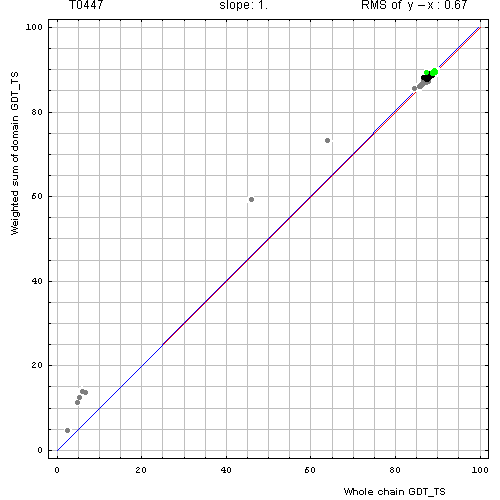
Correlation between weighted by the number of residues sum of GDT-TS scores for domain-based
evaluation (y, vertical axis)
and whole chain GDT-TS (x, horizontal axis).
Before we examine all targets to find a data-dictated cutoff for domain-based evaluation, additional issue needs to be considered. Some proteins, while being evolutionarily single-domain proteins, experience domain swaps. Domain swap is defined as a structural "exchange" of protein regions between monomers in an oligomer. For instance, T0459 is a dimeric winged Helix-Turn-Helix (wHTH) domain with an N-terminal β-hairpin (blue). This N-terminal β-hairpin (blue) packs against a different chain (white), and a β-hairpin (white) from the other chain packs against the first chain (rainbow), illustrating the swap:
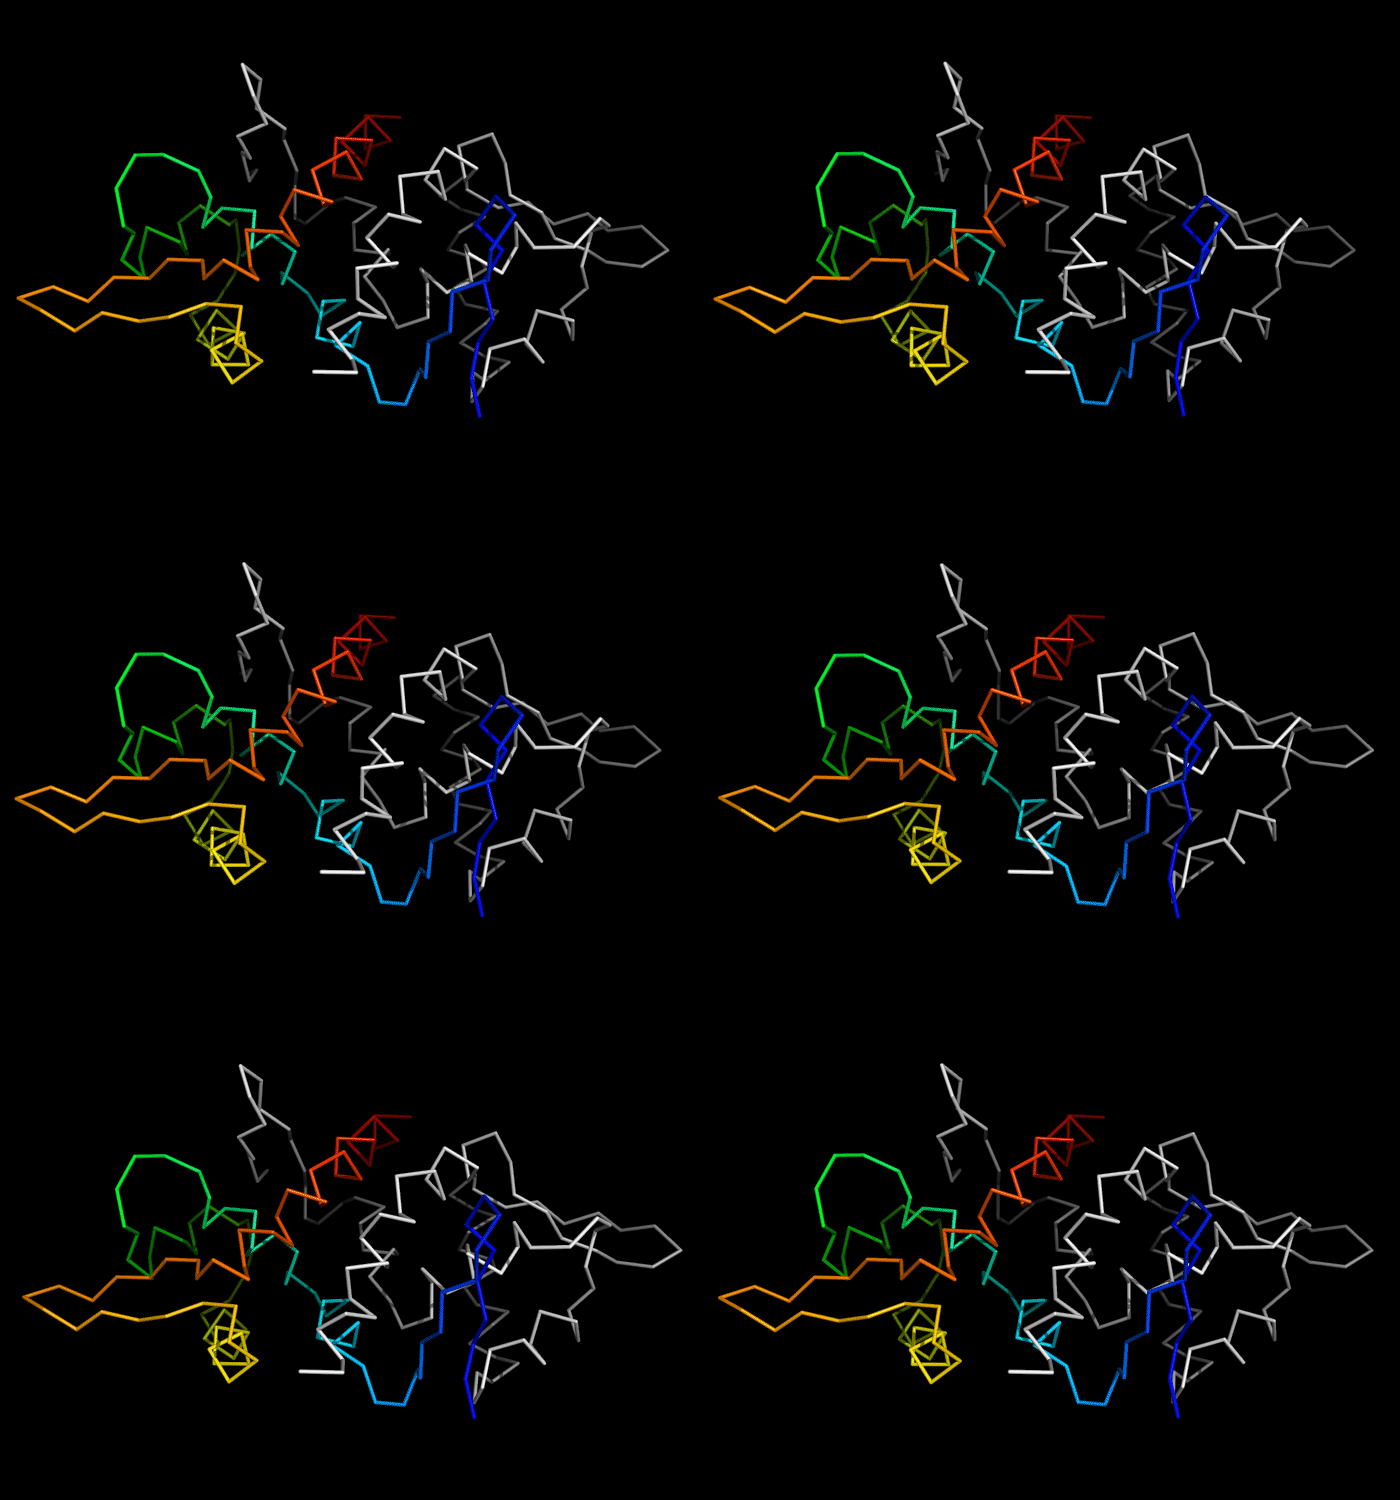
Ribbon diagram of
459: 3df8 chain A
(rainbow) with its symmetry mate (white).
Rainbow-colored compact domain with a swap is composed of segments from both chains:
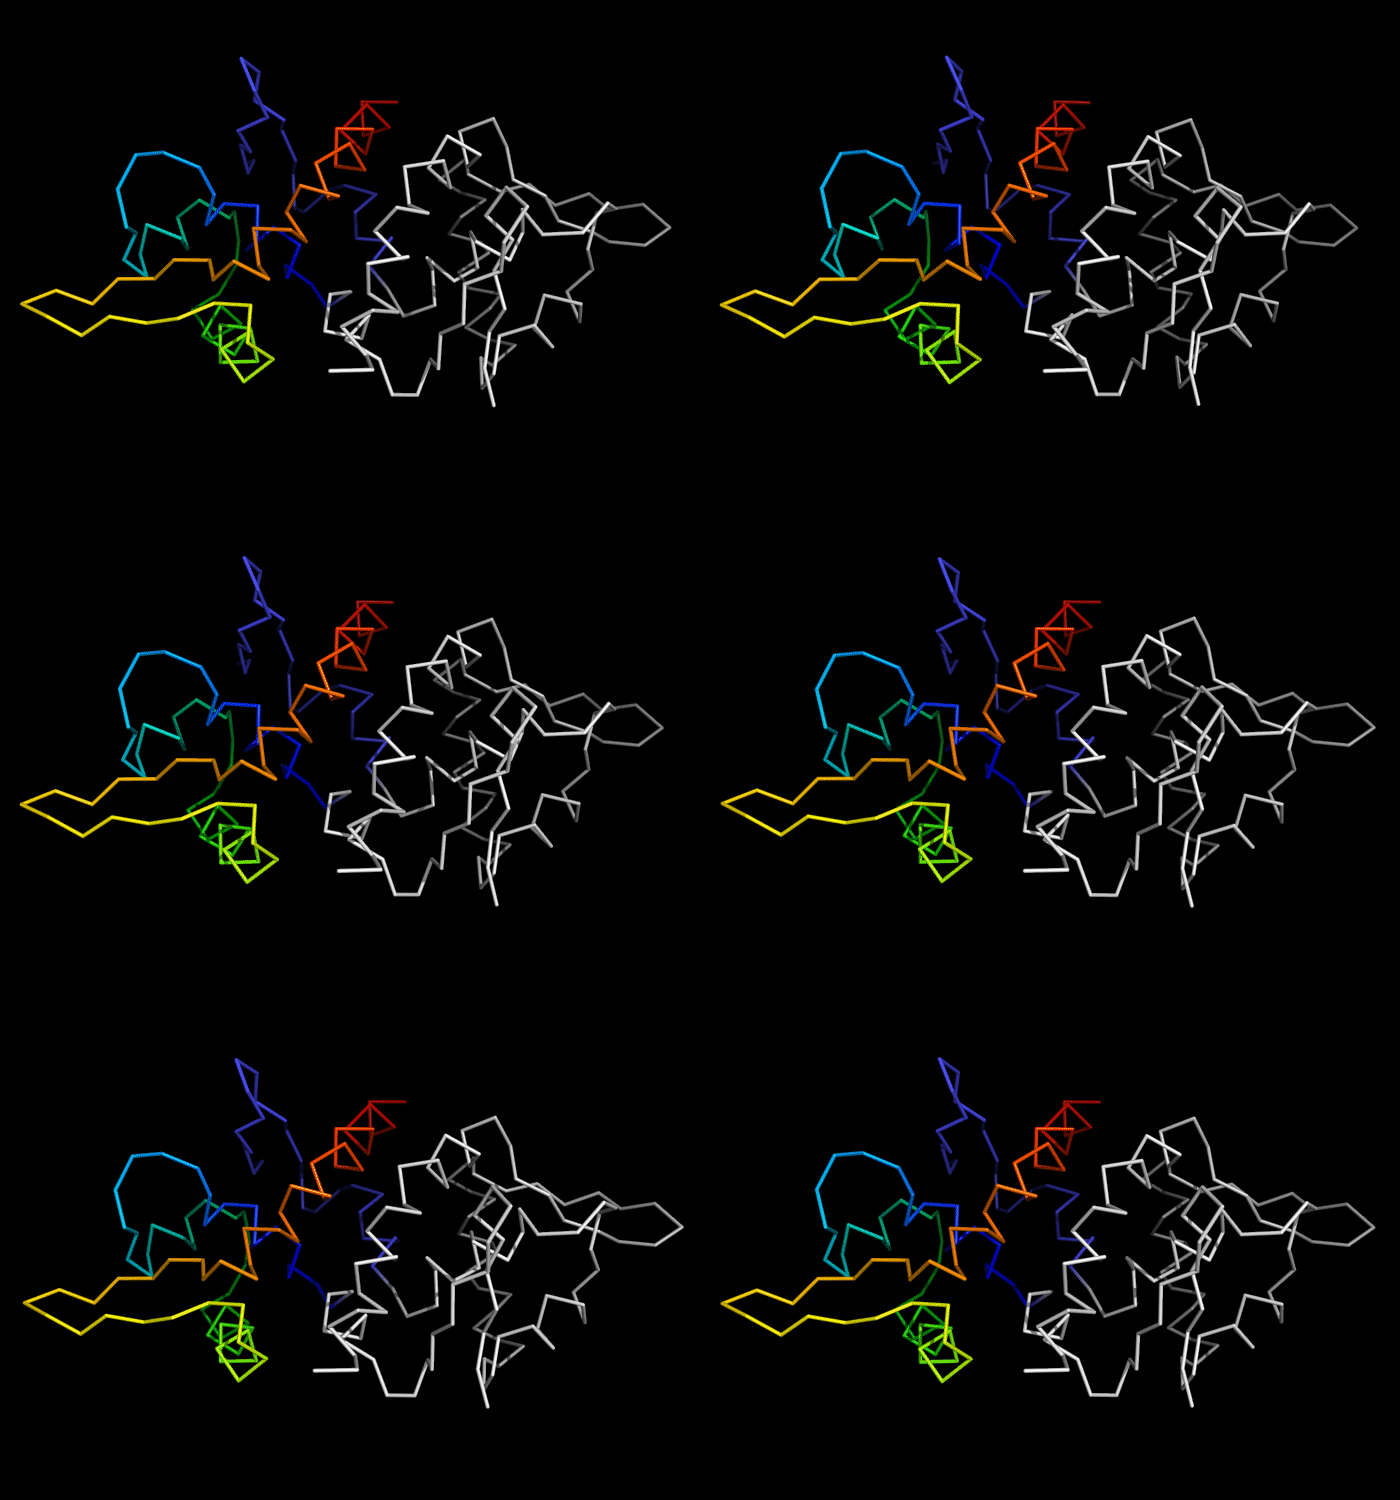
Ribbon diagram of
459: 3df8 chain A with a swapped N-terminal β-hairpin from its symmetry mate chain
(rainbow)
and the swapped hairpin symmetry mate chain (white).
Since predictions are made for monomers, it might be unreasonable to expect swap predictions, as such monomers are not globular. However, it is possible that some servers predict the swapped monomer, i.e. a monomer in which position of the swapped region does not match its position in the structure of the monomer, but does match the position of this region from another monomer that swaps this region with the first monomer. Alternatively, it is possible that no server predicts either of the two positions for the swapped region, and evaluation over the domain core with the swapped region removed can be useful. Thus three evaluations were performed on targets with domain swaps. For instance, the following structures were used in T0459 evaluation:
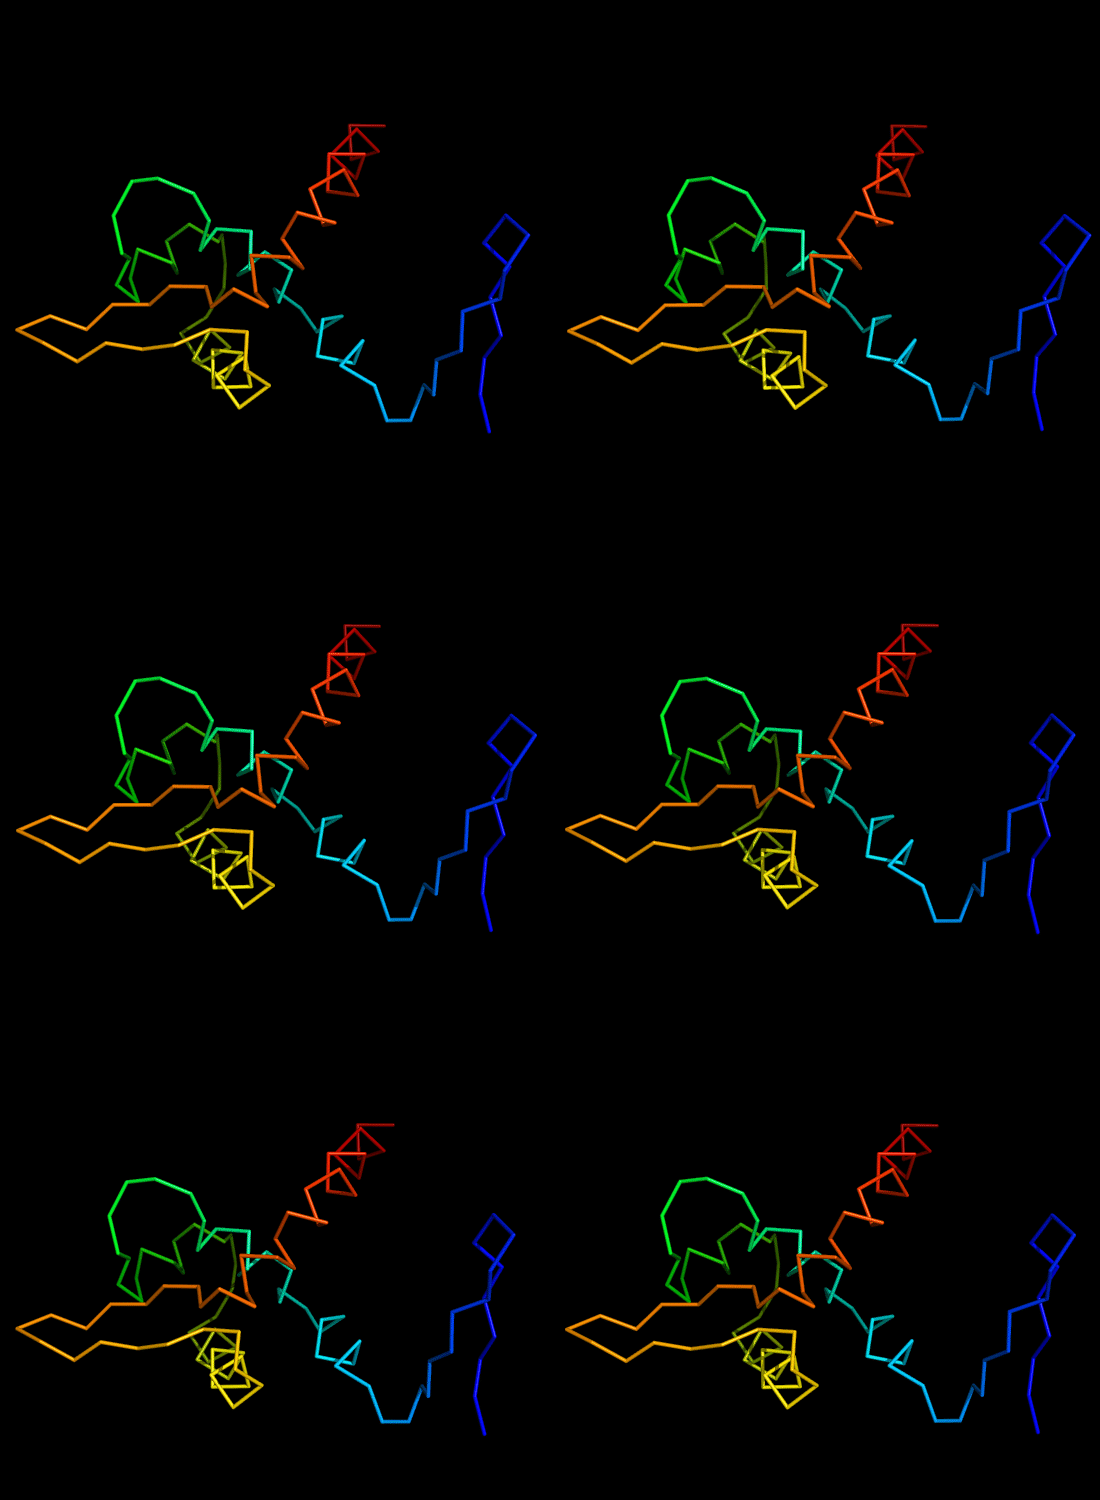
whole chain 459: 3df8 chain A
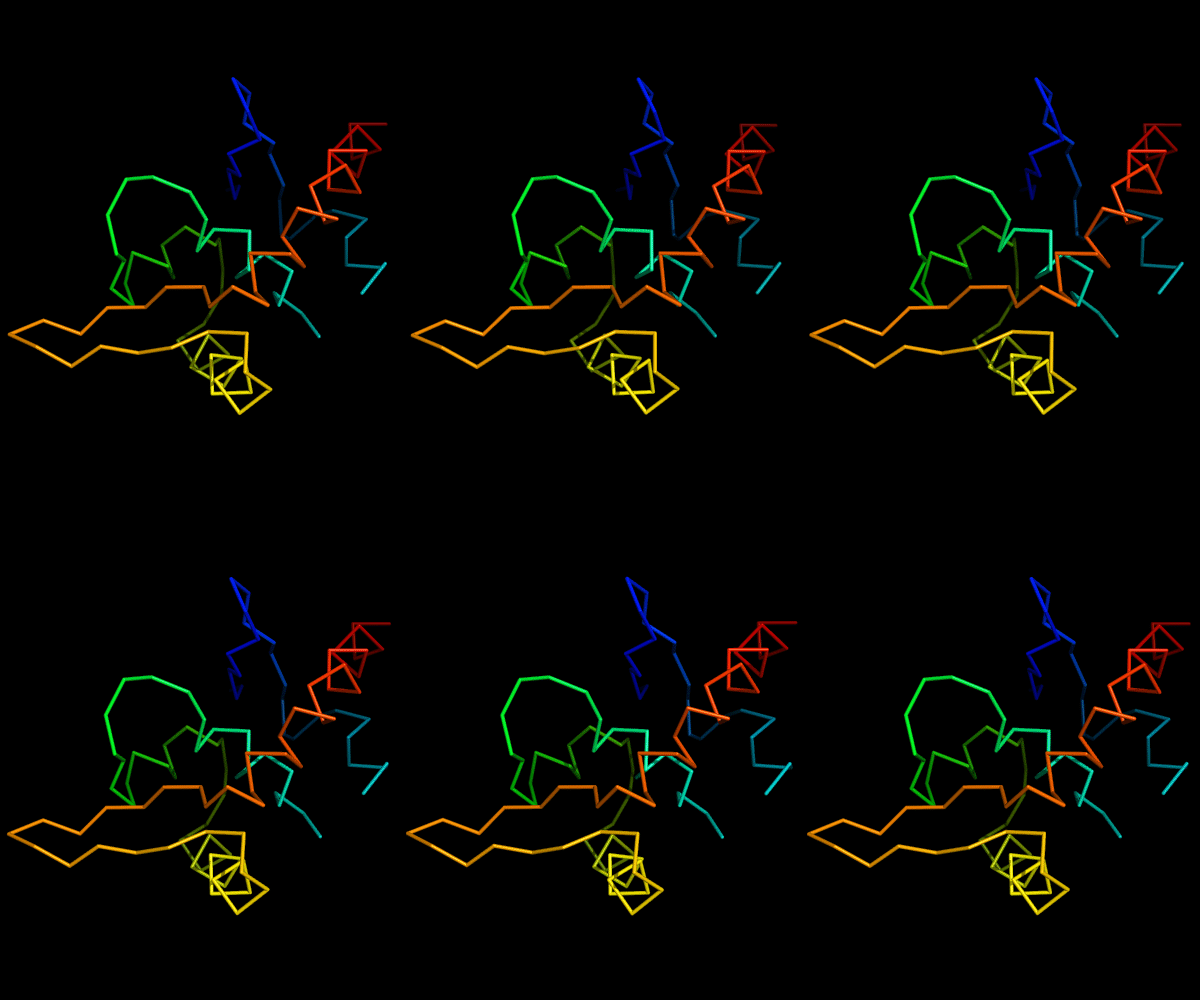
Domain-swapped 459: 3df8 chain B*:-2-22 plus chain A:23-106.
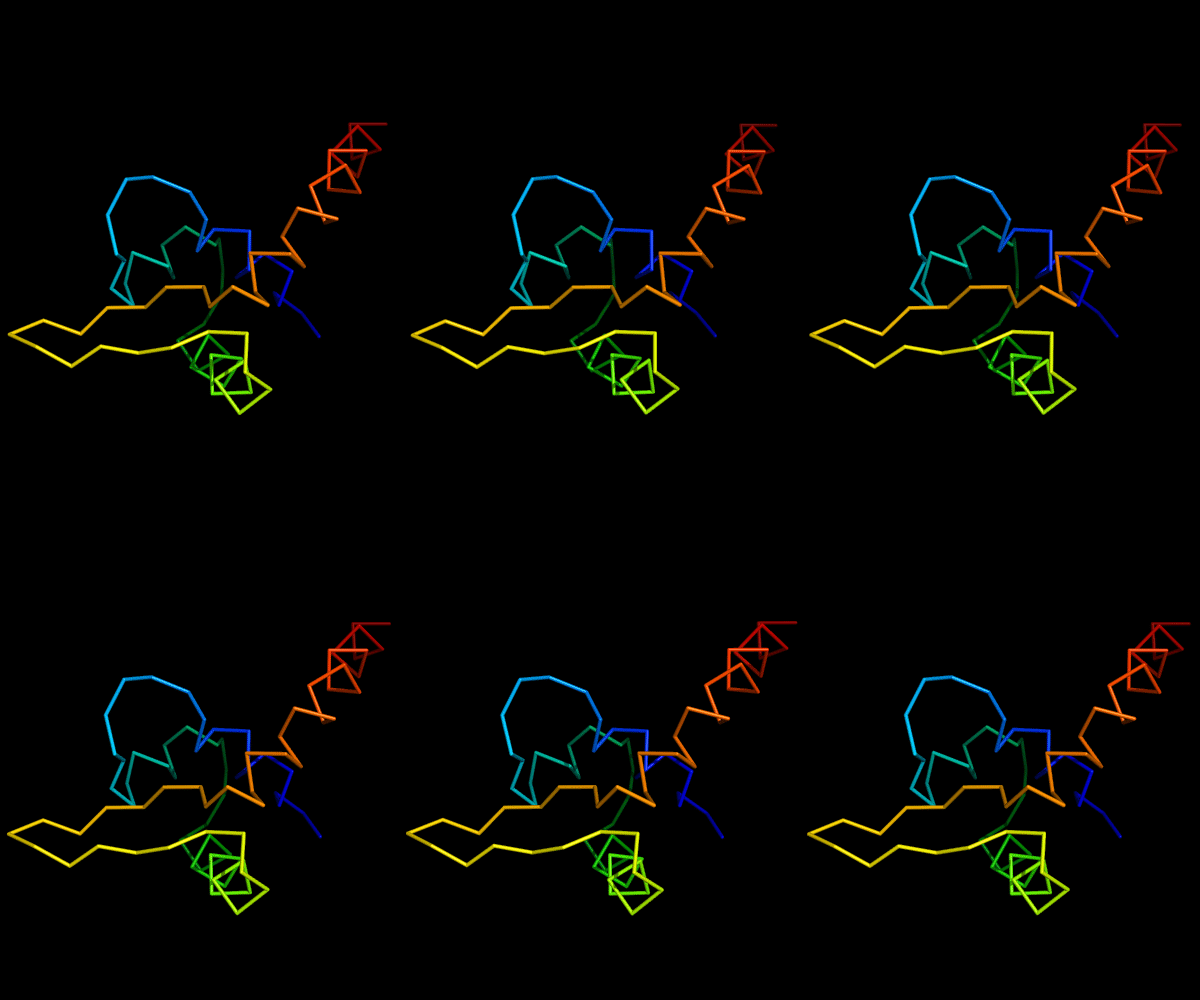
459 with domain-swapped segment removed: 3df8 chain A:23-106.
Correlation plots for the two domain definitions (swapped and swapped segment removed) of this single-domain target reveal differences:
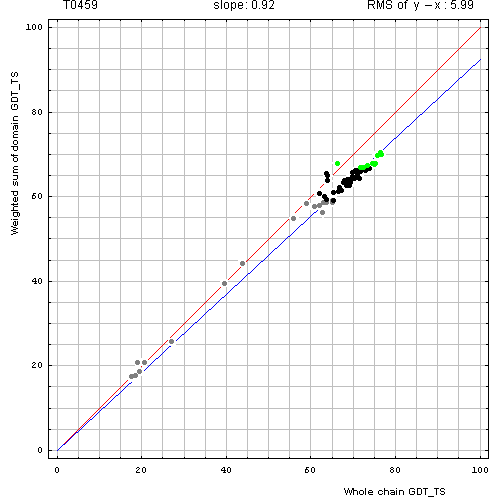
Correlation between GDT-TS scores for domain-based evaluation with a swapped domain (y, vertical axis)
and whole chain GDT-TS (x, horizontal axis).
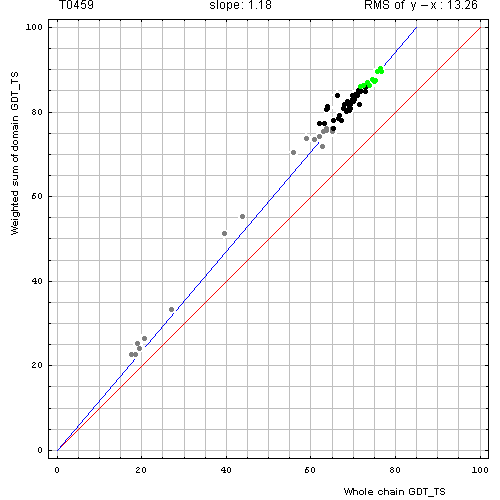
Correlation between GDT-TS scores for domain-based evaluation with N-terminal segment removed (just A:23-106, y, vertical axis)
and whole chain GDT-TS (x, horizontal axis).
For single-domain targets, the y-axis shows GDT-TS for the domain evaluation, as the weighted sum is computed over single domain. As the points are below the diagonal on the first plot (swapped domain), servers were not predicting the swap, but rather placing the N-terminal hairpin closer to its position in a whole (although less globular) chain. As expected, the points are above the diagonal on the second plot, as the difficult-to-predict region was removed from the target. From these plots it remains unclear, however, how useful either of these domain-based evaluations is compared to the whole-chain evaluation.
To find a cutoff for using 'domain-based' vs. 'whole chain' evaluation, we analyzed the correlation of RMS of the difference between GDT_TS on domains and GDT_TS on the whole chain (RMS of y−x) and the slope of the 0 intercept best-fit line (slope) for all targets:
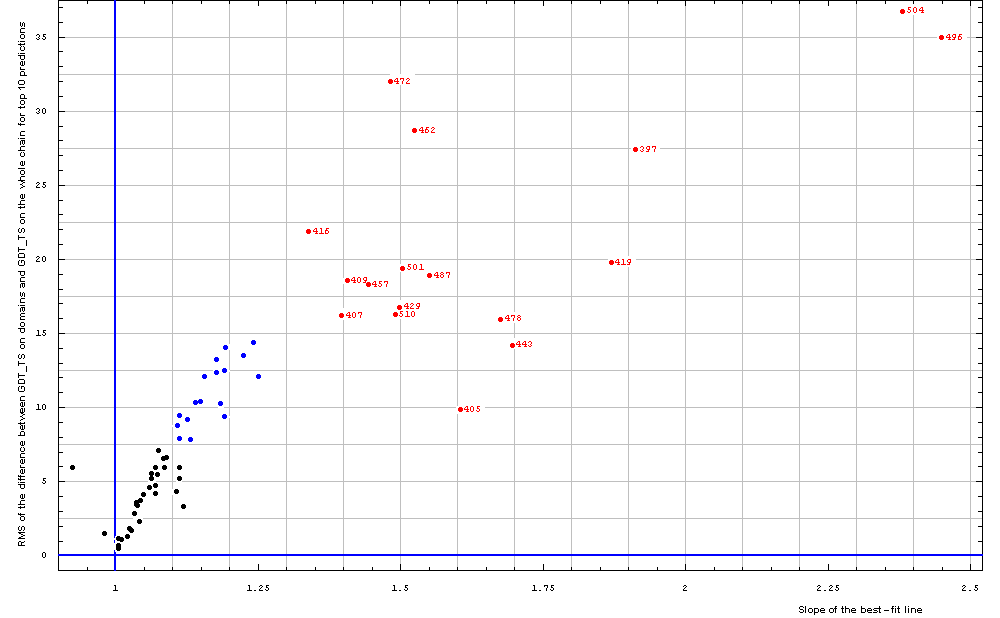
All targets:
Correlation between RMS of the difference between GDT_TS on domains and GDT_TS on the whole chain (vertical axis)
and the slope of the best-fit line (horizontal axis), both computed on top 10 server predictions.
Most targets cluster in the region for RMS of y−x below 15 and the slope below 1.3, thus being close in domain-based evaluation and whole-chain evaluation (black and blue points). Clearly, a few targets (red points, target numbers shown for each point) exhibit large differences and SHOULD be evaluated by domains separately. It might also be useful to look at domain evaluation for the targets with intermediate properties (blue points, RMS of y−x above 7.5), however, they fall within the natural trend with the black points and do not stand out in obvious ways. We examine these targets in more detail:
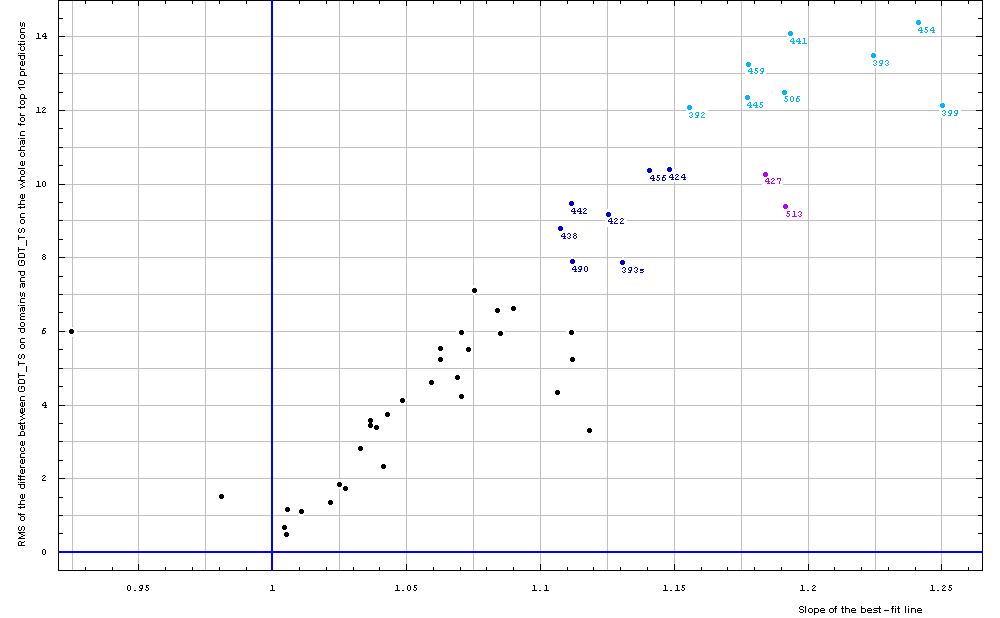
Targets with best-fit slope < 1.13:
Correlation between RMS of the difference between GDT_TS on domains and GDT_TS on the whole chain (vertical axis)
and the slope of the best-fit line (horizontal axis), both computed on top 10 server predictions.
These intermediate targets are further split into 3 groups. Most different group (light-blue) contains targets such as T0441, which is a duplication of Rossmann-like fold domains. Relative position of the two domains in the target structure is a bit different from the one in the template, thus predictions on domains are slightly better than those on the whole chain. T0459, considered above, domain with removed swapped region, is also in this category. These targets do not stand out from the rest as those shown in red, and the decision about their domain evaluation is subjective. Targets shown in pink-blue (T0427 and T0513) have small absolute (y axis), but larger relative (x-axis, measured by the slope) GDT-TS difference. This is because they are difficult targets, different from the templates, so the average GDT-TS for them is low: about 50%. Finally targets shown in dark-blue are closer to targets shown in black and are not that different from them, e.g. T0456 (dark-blue) and T0483 (black) are both protein kinases.
Among the targets shown in black, interesting are those with the slope below 1 (below the diagonal), which means domain-based evaluation for them gave lower scores than full-chain evaluation (T0435 and T0459). These are domain-swapped targets, one of which (T0459) is discussed above.
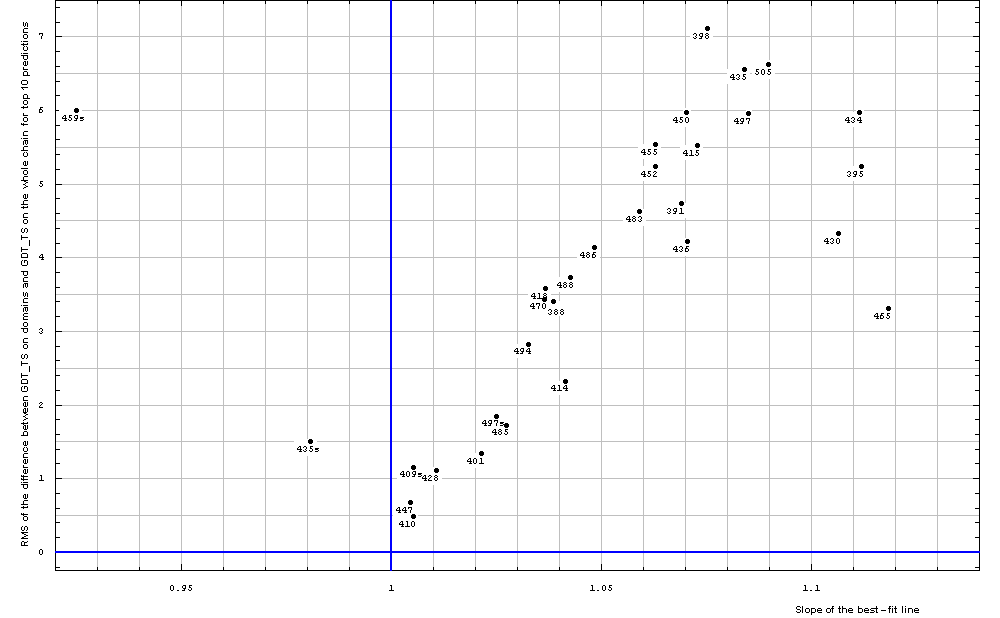
Targets with RMS domain – whole chain difference < 7.5 GDT_TS points:
Correlation between RMS of the difference between GDT_TS on domains
and GDT_TS on the whole chain (vertical axis)
and the slope of the best-fit line (horizontal axis), both computed on top 10 server predictions.
"s" appended to a target number indicates that comparison is made to a swapped domain
Summary: Comparison of domain-based predictions with whole chain predictions revealed a natural, data-dictated cutoff (slope of the zero intercept best-fit line is above 1.3) to select targets that require domain-based evaluation. These targets are: T0397, T0405, T0407, T0409, T0416, T0419, T0429, T0443, T0457, T0462, T0472, T0478, T0487, T0496, T0501, T0504, T0510. Predictions for other targets follow the general trend, are of a more similar quality for 'domain' and 'whole chain' and thus domain-based evaluation may not be necessary for them. It is important to note that this cutoff was found using CASP8 targets and predictions. It is possible, even likely, that for other target/prediction sets, data may dictate a different cutoff. Therefore similar analysis should be performed on other target sets, rather that this 1.3 slope cutoff being applied to them.
We used only the "red" targets in domain evaluation to combine scores between targets, thus only these targets are split into domains in combined evaluation tables. All other targets were evaluated as whole chain in domain-based evaluation: they are considered to be single-domain targets for the purpose of CASP8 evaluation. However, all domain-based evaluation results for all targets are shown on individual target pages and are available for analysis and model visualization with PyMOL, e.g. see T0447. These "domains" include single domain proteins with certain structure regions removed, and swapped domains.