T0435
methyltransferase domain of human PR domain-containing protein 4 (PRDM4) from Homo sapiens
Target sequence:
>T0435 PRDM4, Homo sapiens, 151 residues
EHGPVTFVPDTPIESRARLSLPKQLVLRQSIVGAEVGVWTGETIPVRTCFGPLIGQQSHSMEVAEWTDKAVNHIWKIYHNGVLEFCIITTDENECNWMMFVRKARNREEQNLVAYPHDGKIFFCTSQDIPPENELLFYYSRDYAQQIGVPE
Structure:
Determined by:
SGC
PDB ID: 3db5
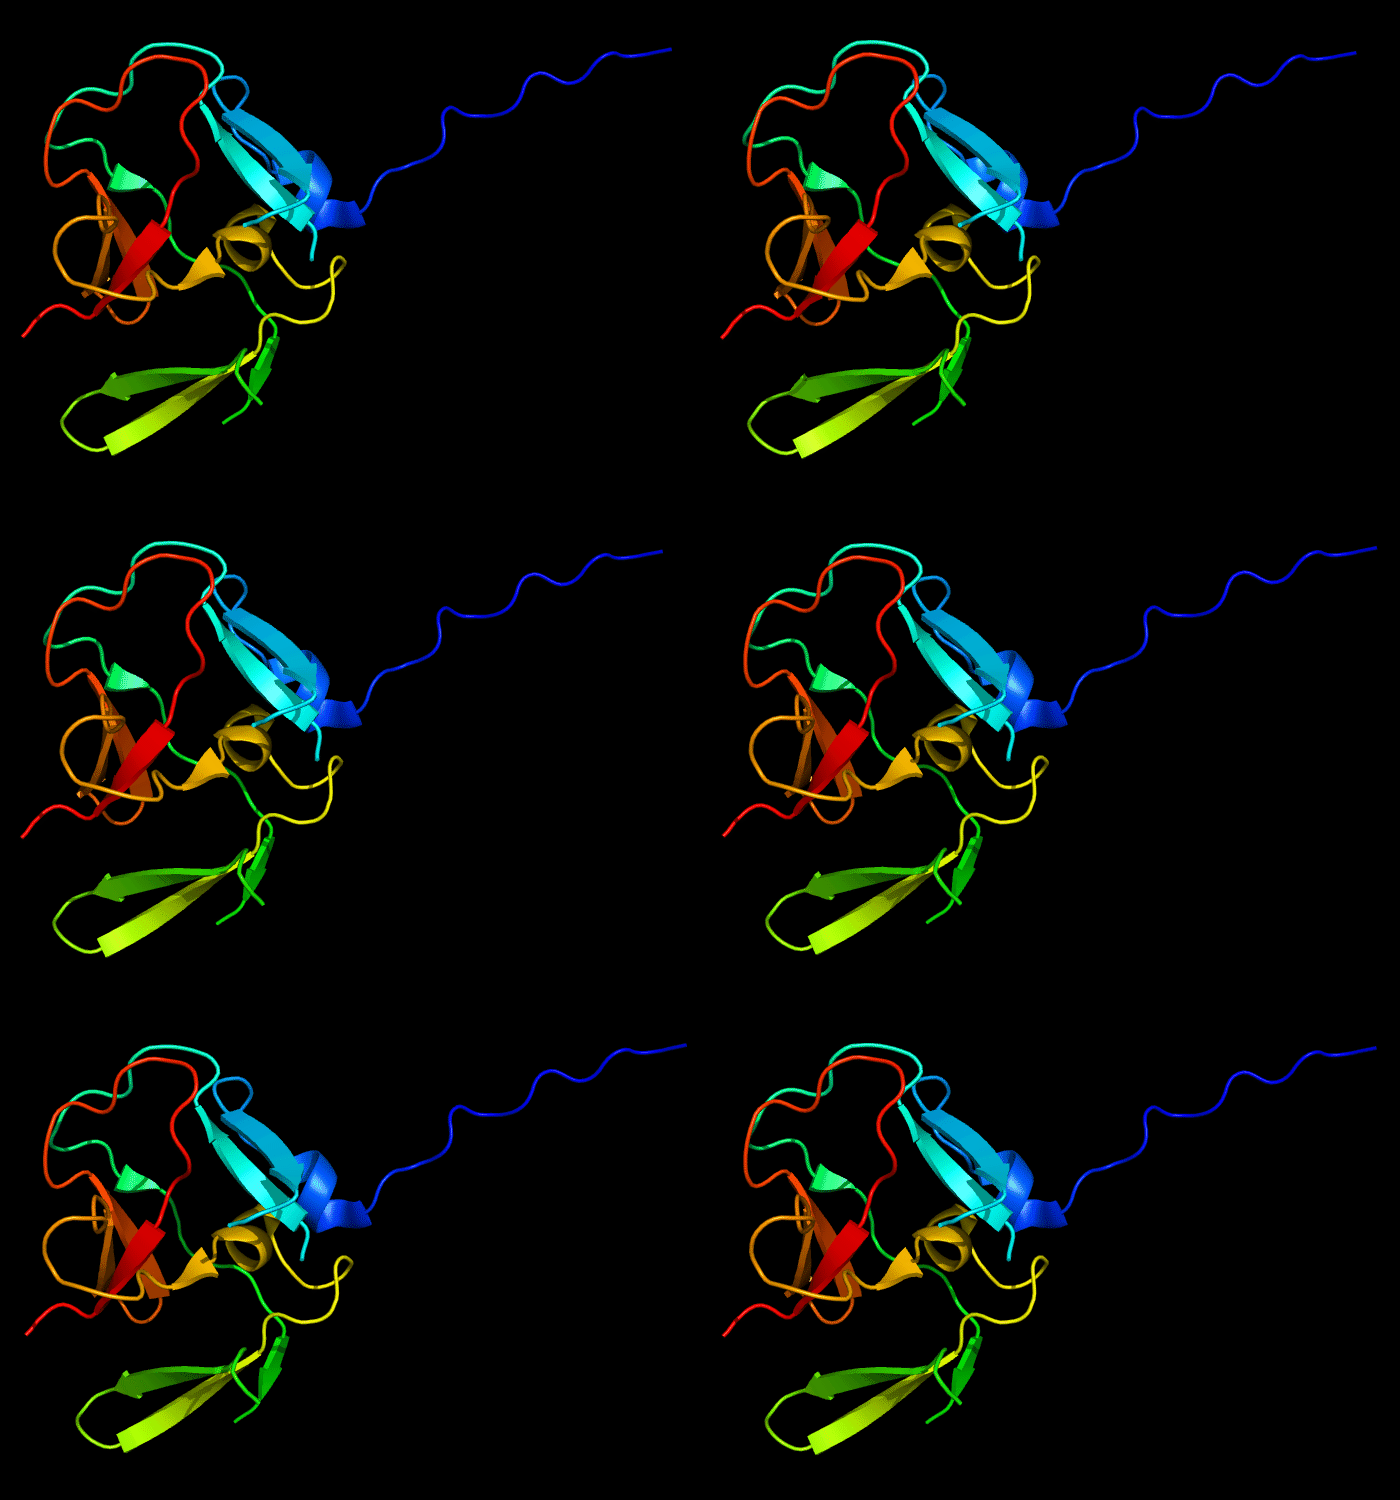
Cartoon diagram of 435: 3db5 chain A residues
Domains: PyMOL of domains
Single domain protein. However, the domain is different from the entire chain due to a domain swap of the N-terminal region. Its residue range in PDB is B:4-13,A:14-141.
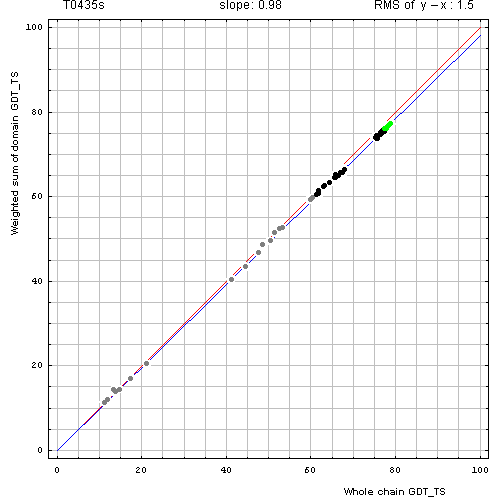
Correlation between GDT-TS scores for domain-based evlatuation with a swapped domain (y, vertical axis)
and whole chain GDT-TS (x, horizontal axis).
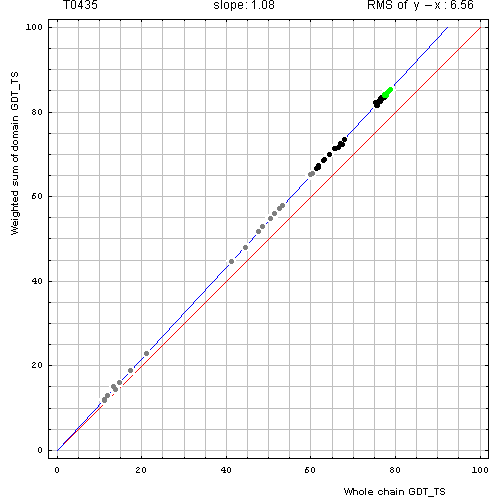
Correlation between GDT-TS scores for domain-based evlatuation with N-terminal segment removed (just A:14-141, y, vertical axis)
and whole chain GDT-TS (x, horizontal axis).
To compute the weighted sum, GDT-TS for each domain was multiplied by the domain length, and this sum was divided by the sum of domain lengths. Each point represents first server model. Green, gray and black points are top 10, bottom 25% and the rest of prediction models. Blue line is the best-fit slope line (intersection 0) to the top 10 server models. Red line is the diagonal. Slope and root mean square y-x distance for the top 10 models (average difference between the domain GDT-TS scores and the whole chain GDT-TS score) are shown above the plot.
Structure classification:
β-clip fold.
CASP category:
Whole chain: Comparative modeling:medium.
Domain (swap segment removed): Comparative modeling:easy. Domain (swap): Comparative modeling:medium.
Closest templates:
2qpw.
Target sequence - PDB file inconsistencies:
T0435 3db5.pdb T0435.pdb PyMOL PyMOL of domains
T0435    1 EHGPVTFVPDTPIESRARLSLPKQLVLRQSIVGAEVGVWTGETIPVRTCFGPLIGQQSHSMEVAEWTDKAVNHIWKIYHNGVLEFCIITTDENECNWMMFVRKARNREEQNLVAYPHDGKIFFCTSQDIPPENELLFYYSRDYAQQIGVPE 151
           ~~~||||||||||||||||||||||||||||~~~|||||||||||||||||||||||||~~~~~~~~~~~|||||||||||||||||||||||||||||||||||||||||||||||||||||||||||||||||||||||~~~~~~~~~~
3db5A    4 ---PVTFVPDTPIESRARLSLPKQLVLRQSI---EVGVWTGETIPVRTCFGPLIGQQSH-----------VNHIWKIYHNGVLEFCIITTDENECNWMMFVRKARNREEQNLVAYPHDGKIFFCTSQDIPPENELLFYYSR---------- 141
Residue change log: change 98, 99, MSE to MET;
We suggest to evaluate this target as a single domain spanning whole chain. However, the domain is different from the entire chain due to a domain swap of the N-terminal region. Its residue range in PDB is B:4-13, A:14-141. Since no server predicted the swap well, we removed the swapped N-terminal segment (pdb A:4-A:13) for evaluation, resulting this domain definition:
1st domain: target 14-31, 35-59, 71-141 ; pdb 14-31, 35-59, 71-141
Sequence classification:
SET domain in Pfam.
Comments:
This protein is a close homolog of T0434.
Server predictions:
T0435:pdb 4-141:seq 4-141:CM_medium; alignment
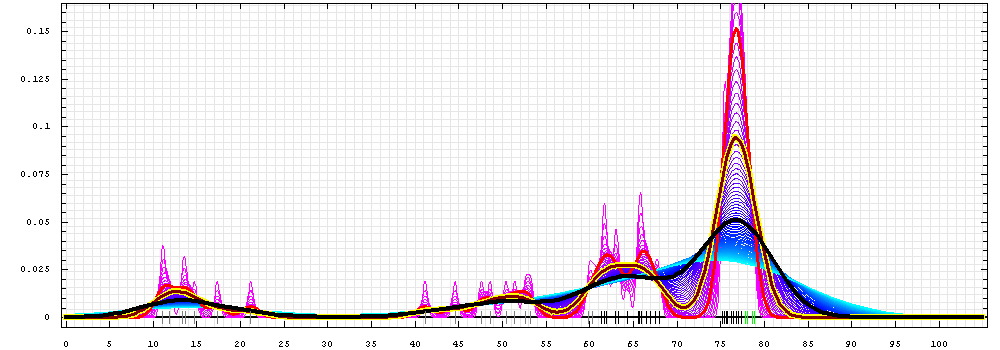
First models for T0435:
Gaussian kernel density estimation
for GDT-TS scores of the
first server models, plotted at various bandwidths (=standard deviations).
The GDT-TS scores are shown as a spectrum along
the horizontal axis: each bar represents first server model. The bars are
colored
green, gray and black for top 10, bottom 25% and the rest of servers.
The family of curves with varying
bandwidth is shown. Bandwidth varies from 0.3 to 8.2 GDT-TS % units
with a step of 0.1, which corresponds to the
color ramp from magenta through blue to cyan. Thicker curves: red,
yellow-framed brown and black, correspond to bandwidths 1, 2 and 4
respectively.
435_1:pdb 14-141:seq 14-141:CM_easy; alignment
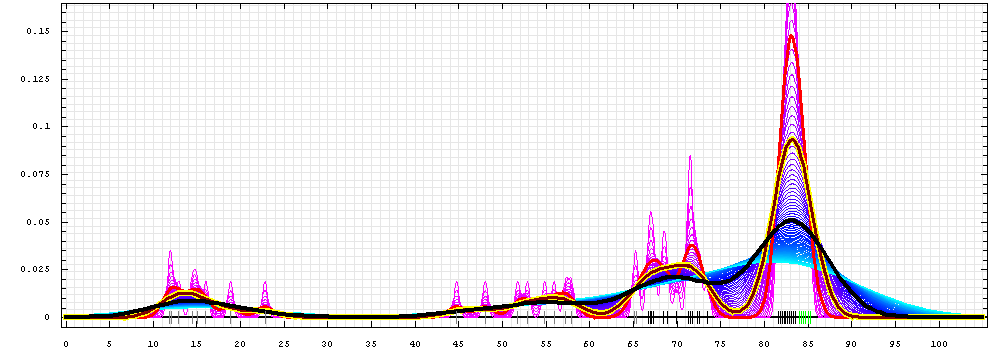
First models for T0435_1:
Gaussian kernel density estimation
for GDT-TS scores of the
first server models, plotted at various bandwidths (=standard deviations).
The GDT-TS scores are shown as a spectrum along
the horizontal axis: each bar represents first server model. The bars are
colored
green, gray and black for top 10, bottom 25% and the rest of servers.
The family of curves with varying
bandwidth is shown. Bandwidth varies from 0.3 to 8.2 GDT-TS % units
with a step of 0.1, which corresponds to the
color ramp from magenta through blue to cyan. Thicker curves: red,
yellow-framed brown and black, correspond to bandwidths 1, 2 and 4
respectively.
435_1s:pdb B:4-13,A:14-141:seq 4-13,14-141:CM_medium; alignment
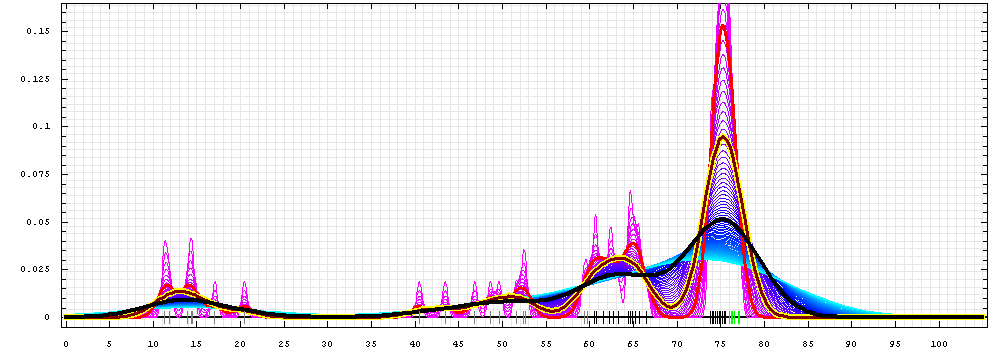
First models for T0435_1s:
Gaussian kernel density estimation
for GDT-TS scores of the
first server models, plotted at various bandwidths (=standard deviations).
The GDT-TS scores are shown as a spectrum along
the horizontal axis: each bar represents first server model. The bars are
colored
green, gray and black for top 10, bottom 25% and the rest of servers.
The family of curves with varying
bandwidth is shown. Bandwidth varies from 0.3 to 8.2 GDT-TS % units
with a step of 0.1, which corresponds to the
color ramp from magenta through blue to cyan. Thicker curves: red,
yellow-framed brown and black, correspond to bandwidths 1, 2 and 4
respectively.
click on a score in the table below to display the model in PyMOL
| # | GROUP ↓ | TS ↓ | TR ↓ | CS ↓ | TS ↓ | TR ↓ | CS ↓ | TS ↓ | TR ↓ | CS ↓ | TS ↓ | TR ↓ | CS ↓ | TS ↓ | TR ↓ | CS ↓ | TS ↓ | TR ↓ | CS ↓ | TS ↓ | TR ↓ | CS ↓ | TS ↓ | TR ↓ | CS ↓ | TS ↓ | TR ↓ | CS ↓ | TS ↓ | TR ↓ | CS ↓ | TS ↓ | TR ↓ | CS ↓ | TS ↓ | TR ↓ | CS ↓ | ↓ GROUP | # |
|---|---|---|---|---|---|---|---|---|---|---|---|---|---|---|---|---|---|---|---|---|---|---|---|---|---|---|---|---|---|---|---|---|---|---|---|---|---|---|---|
| T0435 | 435_1 | 435_1s | T0435 | 435_1 | 435_1s | T0435 | 435_1 | 435_1s | T0435 | 435_1 | 435_1s | ||||||||||||||||||||||||||||
| First score | First Z-score | Best score | Best Z-score | ||||||||||||||||||||||||||||||||||||
| 1 | Zhang−Server | 78.83 | 73.99 | 83.80 | 85.31 | 80.19 | 84.34 | 77.18 | 72.42 | 77.43 | 0.94 | 0.85 | 0.80 | 0.94 | 0.87 | 0.80 | 0.93 | 0.88 | 0.81 | 78.83 | 76.28 | 83.80 | 85.31 | 81.94 | 84.34 | 77.18 | 74.01 | 77.43 | 0.88 | 0.93 | 0.71 | 0.87 | 0.87 | 0.70 | 0.86 | 0.90 | 0.72 | Zhang−Server | 1 |
| 2 | YASARA | 78.63 | 75.00 | 85.29 | 85.09 | 81.14 | 85.97 | 76.98 | 73.41 | 79.02 | 0.92 | 0.94 | 0.92 | 0.92 | 0.95 | 0.93 | 0.91 | 0.97 | 0.96 | 78.63 | 76.01 | 85.29 | 85.09 | 82.24 | 85.97 | 76.98 | 74.41 | 79.02 | 0.85 | 0.90 | 0.86 | 0.84 | 0.90 | 0.87 | 0.83 | 0.95 | 0.90 | YASARA | 2 |
| 3 | HHpred2 | 78.02 | 74.66 | 83.23 | 84.65 | 80.99 | 83.78 | 76.59 | 73.15 | 76.66 | 0.86 | 0.91 | 0.76 | 0.87 | 0.94 | 0.75 | 0.87 | 0.95 | 0.74 | 78.02 | 74.66 | 83.23 | 84.65 | 80.99 | 83.78 | 76.59 | 73.15 | 76.66 | 0.78 | 0.76 | 0.65 | 0.79 | 0.77 | 0.65 | 0.78 | 0.80 | 0.64 | HHpred2 | 3 |
| 4 | BioSerf | 78.02 | 74.13 | 83.86 | 84.65 | 80.41 | 84.19 | 76.59 | 73.28 | 77.40 | 0.86 | 0.86 | 0.81 | 0.87 | 0.89 | 0.78 | 0.87 | 0.96 | 0.81 | 78.02 | 74.13 | 83.86 | 84.65 | 80.41 | 84.19 | 76.59 | 73.28 | 77.40 | 0.78 | 0.70 | 0.72 | 0.79 | 0.71 | 0.69 | 0.78 | 0.82 | 0.72 | BioSerf | 4 |
| 5 | LEE−SERVER | 78.02 | 71.30 | 84.51 | 84.65 | 77.34 | 84.92 | 76.59 | 69.71 | 78.05 | 0.86 | 0.60 | 0.86 | 0.87 | 0.62 | 0.84 | 0.87 | 0.61 | 0.87 | 78.02 | 75.20 | 84.51 | 84.65 | 81.14 | 84.92 | 76.59 | 73.88 | 78.05 | 0.78 | 0.82 | 0.78 | 0.79 | 0.79 | 0.76 | 0.78 | 0.89 | 0.79 | LEE−SERVER | 5 |
| 6 | MUSTER | 77.82 | 74.46 | 83.42 | 84.43 | 80.78 | 83.88 | 76.39 | 72.95 | 76.99 | 0.84 | 0.89 | 0.77 | 0.85 | 0.92 | 0.76 | 0.85 | 0.93 | 0.77 | 77.82 | 74.46 | 83.42 | 84.43 | 80.78 | 83.88 | 76.39 | 72.95 | 76.99 | 0.75 | 0.74 | 0.67 | 0.77 | 0.75 | 0.66 | 0.76 | 0.78 | 0.67 | MUSTER | 6 |
| 7 | MULTICOM−REFINE | 77.82 | 72.72 | 83.21 | 83.99 | 79.75 | 83.88 | 75.99 | 71.89 | 76.84 | 0.84 | 0.73 | 0.75 | 0.81 | 0.83 | 0.76 | 0.81 | 0.83 | 0.76 | 77.82 | 72.85 | 83.57 | 83.99 | 79.75 | 84.16 | 75.99 | 71.89 | 77.14 | 0.75 | 0.56 | 0.69 | 0.71 | 0.64 | 0.69 | 0.71 | 0.66 | 0.69 | MULTICOM−REFINE | 7 |
| 8 | HHpred5 | 77.42 | 75.00 | 83.25 | 83.99 | 81.36 | 83.73 | 75.99 | 72.02 | 76.71 | 0.80 | 0.94 | 0.76 | 0.81 | 0.97 | 0.75 | 0.81 | 0.84 | 0.75 | 77.42 | 75.00 | 83.25 | 83.99 | 81.36 | 83.73 | 75.99 | 72.02 | 76.71 | 0.70 | 0.79 | 0.65 | 0.71 | 0.81 | 0.64 | 0.71 | 0.67 | 0.64 | HHpred5 | 8 |
| 9 | MULTICOM−CMFR | 77.42 | 74.60 | 83.44 | 83.33 | 80.26 | 84.09 | 75.40 | 72.49 | 77.06 | 0.80 | 0.90 | 0.77 | 0.75 | 0.87 | 0.78 | 0.75 | 0.88 | 0.78 | 77.42 | 74.60 | 83.44 | 83.33 | 80.26 | 84.09 | 75.40 | 72.49 | 77.06 | 0.70 | 0.75 | 0.67 | 0.64 | 0.70 | 0.68 | 0.63 | 0.72 | 0.68 | MULTICOM−CMFR | 9 |
| 10 | HHpred4 | 77.42 | 74.06 | 83.16 | 84.21 | 80.56 | 83.79 | 76.19 | 72.75 | 76.95 | 0.80 | 0.85 | 0.75 | 0.83 | 0.90 | 0.75 | 0.83 | 0.91 | 0.77 | 77.42 | 74.06 | 83.16 | 84.21 | 80.56 | 83.79 | 76.19 | 72.75 | 76.95 | 0.70 | 0.69 | 0.64 | 0.74 | 0.73 | 0.65 | 0.73 | 0.75 | 0.67 | HHpred4 | 10 |
| 11 | fais−server | 77.42 | 73.79 | 83.42 | 83.99 | 80.04 | 83.80 | 75.99 | 72.16 | 77.04 | 0.80 | 0.83 | 0.77 | 0.81 | 0.86 | 0.75 | 0.81 | 0.85 | 0.78 | 77.42 | 73.79 | 83.42 | 83.99 | 80.04 | 83.80 | 75.99 | 72.16 | 77.04 | 0.70 | 0.66 | 0.67 | 0.71 | 0.67 | 0.65 | 0.71 | 0.69 | 0.68 | fais−server | 11 |
| 12 | mGenTHREADER | 77.02 | 73.52 | 83.05 | 83.33 | 79.53 | 83.49 | 75.40 | 71.83 | 76.60 | 0.76 | 0.80 | 0.74 | 0.75 | 0.81 | 0.73 | 0.75 | 0.82 | 0.74 | 77.02 | 73.52 | 83.05 | 83.33 | 79.53 | 83.49 | 75.40 | 71.83 | 76.60 | 0.65 | 0.63 | 0.63 | 0.64 | 0.62 | 0.62 | 0.63 | 0.65 | 0.63 | mGenTHREADER | 12 |
| 13 | COMA | 77.02 | 73.52 | 83.52 | 83.33 | 79.09 | 84.01 | 75.59 | 70.17 | 76.92 | 0.76 | 0.80 | 0.78 | 0.75 | 0.77 | 0.77 | 0.77 | 0.66 | 0.77 | 77.02 | 73.52 | 83.59 | 83.33 | 79.09 | 84.10 | 75.59 | 70.17 | 76.97 | 0.65 | 0.63 | 0.69 | 0.64 | 0.58 | 0.68 | 0.66 | 0.46 | 0.67 | COMA | 13 |
| 14 | COMA−M | 77.02 | 73.39 | 82.77 | 83.33 | 77.63 | 83.31 | 75.40 | 70.64 | 76.26 | 0.76 | 0.79 | 0.72 | 0.75 | 0.65 | 0.71 | 0.75 | 0.70 | 0.71 | 77.62 | 74.93 | 83.59 | 83.99 | 81.07 | 84.10 | 75.99 | 73.21 | 76.97 | 0.73 | 0.79 | 0.69 | 0.71 | 0.78 | 0.68 | 0.71 | 0.81 | 0.67 | COMA−M | 14 |
| 15 | keasar−server | 77.02 | 72.85 | 83.31 | 83.11 | 78.58 | 83.76 | 75.20 | 70.97 | 76.73 | 0.76 | 0.74 | 0.76 | 0.73 | 0.73 | 0.75 | 0.73 | 0.74 | 0.75 | 77.02 | 72.98 | 83.31 | 83.11 | 78.95 | 83.90 | 75.20 | 71.30 | 76.74 | 0.65 | 0.57 | 0.66 | 0.61 | 0.56 | 0.66 | 0.61 | 0.59 | 0.64 | keasar−server | 15 |
| 16 | MUProt | 77.02 | 72.85 | 82.35 | 83.55 | 78.29 | 83.14 | 75.59 | 70.97 | 75.86 | 0.76 | 0.74 | 0.68 | 0.77 | 0.70 | 0.70 | 0.77 | 0.74 | 0.67 | 77.82 | 72.85 | 83.59 | 83.99 | 79.75 | 84.18 | 75.99 | 71.89 | 77.16 | 0.75 | 0.56 | 0.69 | 0.71 | 0.64 | 0.69 | 0.71 | 0.66 | 0.69 | MUProt | 16 |
| 17 | Poing | 76.81 | 73.72 | 82.64 | 83.11 | 78.58 | 83.24 | 75.40 | 71.03 | 76.45 | 0.74 | 0.82 | 0.71 | 0.73 | 0.73 | 0.71 | 0.75 | 0.74 | 0.73 | 76.81 | 73.72 | 82.64 | 83.11 | 78.58 | 83.24 | 75.40 | 71.03 | 76.45 | 0.63 | 0.65 | 0.59 | 0.61 | 0.53 | 0.59 | 0.63 | 0.56 | 0.61 | Poing | 17 |
| 18 | Phyre2 | 76.81 | 73.72 | 82.64 | 83.11 | 78.58 | 83.24 | 75.40 | 71.03 | 76.45 | 0.74 | 0.82 | 0.71 | 0.73 | 0.73 | 0.71 | 0.75 | 0.74 | 0.73 | 76.81 | 73.72 | 82.64 | 83.11 | 78.58 | 83.24 | 75.40 | 71.03 | 76.45 | 0.63 | 0.65 | 0.59 | 0.61 | 0.53 | 0.59 | 0.63 | 0.56 | 0.61 | Phyre2 | 18 |
| 19 | Phragment | 76.81 | 73.72 | 82.64 | 83.11 | 78.58 | 83.24 | 75.40 | 71.03 | 76.45 | 0.74 | 0.82 | 0.71 | 0.73 | 0.73 | 0.71 | 0.75 | 0.74 | 0.73 | 76.81 | 73.72 | 82.64 | 83.11 | 78.58 | 83.24 | 75.40 | 71.03 | 76.45 | 0.63 | 0.65 | 0.59 | 0.61 | 0.53 | 0.59 | 0.63 | 0.56 | 0.61 | Phragment | 19 |
| 20 | FUGUE_KM | 76.81 | 73.32 | 82.52 | 83.33 | 79.53 | 83.49 | 75.40 | 71.83 | 76.40 | 0.74 | 0.79 | 0.70 | 0.75 | 0.81 | 0.73 | 0.75 | 0.82 | 0.72 | 76.81 | 73.32 | 82.52 | 83.33 | 79.53 | 83.49 | 75.40 | 71.83 | 76.40 | 0.63 | 0.61 | 0.58 | 0.64 | 0.62 | 0.62 | 0.63 | 0.65 | 0.61 | FUGUE_KM | 20 |
| 21 | pro−sp3−TASSER | 76.81 | 72.51 | 82.54 | 83.11 | 78.44 | 83.02 | 75.20 | 70.44 | 76.01 | 0.74 | 0.71 | 0.70 | 0.73 | 0.72 | 0.69 | 0.73 | 0.68 | 0.69 | 77.02 | 73.39 | 82.54 | 83.11 | 79.17 | 83.02 | 75.20 | 71.23 | 76.01 | 0.65 | 0.62 | 0.58 | 0.61 | 0.59 | 0.57 | 0.61 | 0.58 | 0.56 | pro−sp3−TASSER | 21 |
| 22 | MULTICOM−RANK | 76.81 | 70.50 | 82.52 | 83.33 | 76.46 | 83.31 | 75.40 | 69.18 | 76.00 | 0.74 | 0.53 | 0.70 | 0.75 | 0.55 | 0.71 | 0.75 | 0.56 | 0.68 | 76.81 | 70.50 | 82.52 | 83.33 | 76.46 | 83.31 | 75.40 | 69.18 | 76.00 | 0.63 | 0.30 | 0.58 | 0.64 | 0.31 | 0.60 | 0.63 | 0.34 | 0.56 | MULTICOM−RANK | 22 |
| 23 | SAM−T02−server | 76.41 | 73.86 | 81.38 | 82.67 | 79.90 | 81.92 | 74.80 | 72.16 | 74.91 | 0.70 | 0.84 | 0.61 | 0.69 | 0.84 | 0.60 | 0.69 | 0.85 | 0.59 | 76.41 | 73.86 | 81.38 | 82.67 | 79.90 | 81.92 | 74.80 | 72.16 | 74.91 | 0.58 | 0.67 | 0.46 | 0.56 | 0.66 | 0.46 | 0.55 | 0.69 | 0.44 | SAM−T02−server | 23 |
| 24 | PS2−server | 76.41 | 73.72 | 83.31 | 83.11 | 80.19 | 83.63 | 75.20 | 72.55 | 76.88 | 0.70 | 0.82 | 0.76 | 0.73 | 0.87 | 0.74 | 0.73 | 0.89 | 0.76 | 76.41 | 73.72 | 83.31 | 83.11 | 80.19 | 83.63 | 75.20 | 72.55 | 76.88 | 0.58 | 0.65 | 0.66 | 0.61 | 0.69 | 0.63 | 0.61 | 0.73 | 0.66 | PS2−server | 24 |
| 25 | PSI | 76.41 | 72.92 | 83.43 | 82.89 | 79.09 | 83.92 | 75.00 | 71.43 | 77.03 | 0.70 | 0.75 | 0.77 | 0.71 | 0.77 | 0.76 | 0.71 | 0.78 | 0.78 | 76.41 | 72.92 | 83.43 | 82.89 | 79.09 | 83.92 | 75.00 | 71.43 | 77.03 | 0.58 | 0.57 | 0.67 | 0.59 | 0.58 | 0.66 | 0.58 | 0.60 | 0.68 | PSI | 25 |
| 26 | Pushchino | 76.41 | 72.78 | 81.08 | 82.89 | 78.95 | 82.68 | 75.00 | 71.30 | 75.01 | 0.70 | 0.74 | 0.58 | 0.71 | 0.76 | 0.66 | 0.71 | 0.77 | 0.60 | 76.41 | 72.78 | 81.08 | 82.89 | 78.95 | 82.68 | 75.00 | 71.30 | 75.01 | 0.58 | 0.55 | 0.43 | 0.59 | 0.56 | 0.53 | 0.58 | 0.59 | 0.45 | Pushchino | 26 |
| 27 | pipe_int | 76.41 | 71.84 | 82.31 | 82.67 | 77.70 | 82.85 | 74.80 | 70.17 | 75.77 | 0.70 | 0.65 | 0.68 | 0.69 | 0.65 | 0.68 | 0.69 | 0.66 | 0.66 | 76.61 | 74.46 | 83.35 | 83.11 | 80.78 | 83.73 | 75.00 | 72.88 | 76.81 | 0.60 | 0.74 | 0.66 | 0.61 | 0.75 | 0.64 | 0.58 | 0.77 | 0.65 | pipe_int | 27 |
| 28 | RAPTOR | 76.41 | 68.48 | 83.22 | 82.46 | 73.83 | 83.95 | 74.60 | 66.80 | 76.69 | 0.70 | 0.35 | 0.75 | 0.67 | 0.32 | 0.76 | 0.67 | 0.33 | 0.75 | 77.42 | 75.27 | 83.40 | 83.99 | 81.65 | 83.95 | 75.99 | 73.74 | 77.03 | 0.70 | 0.82 | 0.67 | 0.71 | 0.84 | 0.66 | 0.71 | 0.87 | 0.68 | RAPTOR | 28 |
| 29 | FFASstandard | 76.21 | 73.12 | 82.40 | 82.67 | 79.31 | 83.37 | 74.80 | 71.63 | 75.93 | 0.68 | 0.77 | 0.69 | 0.69 | 0.79 | 0.72 | 0.69 | 0.80 | 0.68 | 76.21 | 73.12 | 82.40 | 82.67 | 79.31 | 83.37 | 74.80 | 71.63 | 75.93 | 0.55 | 0.59 | 0.57 | 0.56 | 0.60 | 0.60 | 0.55 | 0.63 | 0.55 | FFASstandard | 29 |
| 30 | SAM−T08−server | 75.81 | 72.31 | 83.65 | 81.58 | 77.78 | 84.14 | 73.81 | 71.30 | 77.03 | 0.64 | 0.69 | 0.79 | 0.59 | 0.66 | 0.78 | 0.58 | 0.77 | 0.78 | 76.61 | 73.66 | 83.65 | 83.11 | 79.90 | 84.14 | 75.20 | 72.16 | 77.03 | 0.60 | 0.65 | 0.69 | 0.61 | 0.66 | 0.68 | 0.61 | 0.69 | 0.68 | SAM−T08−server | 30 |
| 31 | FFASsuboptimal | 75.81 | 71.37 | 82.09 | 82.24 | 77.41 | 82.62 | 74.41 | 69.91 | 75.55 | 0.64 | 0.61 | 0.66 | 0.65 | 0.63 | 0.66 | 0.65 | 0.63 | 0.64 | 76.61 | 73.66 | 83.47 | 83.33 | 80.12 | 84.01 | 75.20 | 72.16 | 76.85 | 0.60 | 0.65 | 0.68 | 0.64 | 0.68 | 0.67 | 0.61 | 0.69 | 0.66 | FFASsuboptimal | 31 |
| 32 | MULTICOM−CLUSTER | 75.61 | 65.39 | 83.75 | 82.24 | 71.13 | 84.33 | 74.41 | 64.22 | 77.28 | 0.62 | 0.06 | 0.80 | 0.65 | 0.09 | 0.80 | 0.65 | 0.08 | 0.80 | 76.81 | 70.50 | 83.75 | 83.33 | 76.46 | 84.33 | 75.40 | 69.18 | 77.28 | 0.63 | 0.30 | 0.70 | 0.64 | 0.31 | 0.70 | 0.63 | 0.34 | 0.71 | MULTICOM−CLUSTER | 32 |
| 33 | LOOPP_Server | 75.40 | 73.79 | 81.28 | 82.02 | 80.26 | 81.96 | 74.21 | 72.62 | 74.98 | 0.60 | 0.83 | 0.60 | 0.63 | 0.87 | 0.60 | 0.63 | 0.90 | 0.59 | 75.40 | 73.79 | 81.28 | 82.02 | 80.26 | 81.96 | 74.21 | 72.62 | 74.98 | 0.45 | 0.66 | 0.45 | 0.49 | 0.70 | 0.46 | 0.48 | 0.74 | 0.45 | LOOPP_Server | 33 |
| 34 | FFASflextemplate | 75.40 | 71.91 | 79.84 | 81.80 | 78.00 | 80.79 | 74.01 | 70.44 | 73.59 | 0.60 | 0.66 | 0.48 | 0.61 | 0.68 | 0.51 | 0.60 | 0.68 | 0.47 | 76.01 | 72.65 | 80.42 | 82.46 | 78.58 | 81.35 | 74.60 | 70.97 | 74.11 | 0.53 | 0.54 | 0.37 | 0.54 | 0.53 | 0.40 | 0.53 | 0.55 | 0.35 | FFASflextemplate | 34 |
| 35 | FALCON_CONSENSUS | 75.40 | 71.10 | 80.47 | 81.58 | 76.90 | 80.82 | 73.81 | 69.97 | 74.54 | 0.60 | 0.58 | 0.53 | 0.59 | 0.58 | 0.51 | 0.58 | 0.64 | 0.55 | 77.22 | 75.47 | 83.76 | 83.99 | 82.09 | 84.19 | 76.19 | 69.97 | 77.35 | 0.68 | 0.85 | 0.70 | 0.71 | 0.88 | 0.69 | 0.73 | 0.43 | 0.71 | FALCON_CONSENSUS | 35 |
| 36 | FALCON | 75.40 | 71.10 | 80.47 | 81.58 | 76.90 | 80.82 | 73.81 | 69.97 | 74.54 | 0.60 | 0.58 | 0.53 | 0.59 | 0.58 | 0.51 | 0.58 | 0.64 | 0.55 | 77.22 | 75.47 | 83.76 | 83.99 | 82.09 | 84.19 | 76.19 | 69.97 | 77.35 | 0.68 | 0.85 | 0.70 | 0.71 | 0.88 | 0.69 | 0.73 | 0.43 | 0.71 | FALCON | 36 |
| 37 | SAM−T06−server | 75.20 | 72.38 | 81.20 | 82.24 | 79.17 | 81.79 | 74.01 | 65.67 | 74.78 | 0.58 | 0.70 | 0.59 | 0.65 | 0.78 | 0.59 | 0.60 | 0.22 | 0.57 | 76.41 | 72.38 | 81.20 | 82.46 | 79.17 | 81.79 | 74.60 | 70.50 | 74.78 | 0.58 | 0.51 | 0.45 | 0.54 | 0.59 | 0.44 | 0.53 | 0.49 | 0.42 | SAM−T06−server | 37 |
| 38 | FEIG | 67.94 | 62.57 | 76.66 | 73.47 | 67.33 | 77.25 | 66.47 | 61.71 | 70.77 | 0.23 | 0.22 | 0.21 | 69.36 | 62.57 | 76.66 | 75.44 | 67.40 | 77.25 | 71.03 | 63.09 | 70.77 | 0.07 | FEIG | 38 | ||||||||||||||
| 39 | 3D−JIGSAW_V3 | 67.54 | 63.51 | 66.70 | 72.37 | 67.98 | 67.61 | 65.67 | 61.57 | 61.86 | 67.54 | 63.78 | 67.50 | 73.25 | 69.44 | 68.46 | 66.47 | 62.90 | 62.67 | 3D−JIGSAW_V3 | 39 | ||||||||||||||||||
| 40 | GS−KudlatyPred | 66.94 | 62.63 | 71.15 | 72.59 | 67.91 | 71.95 | 65.67 | 61.44 | 66.04 | 66.94 | 62.63 | 71.15 | 72.59 | 67.91 | 71.95 | 65.67 | 61.44 | 66.04 | GS−KudlatyPred | 40 | ||||||||||||||||||
| 41 | FAMSD | 66.53 | 59.14 | 76.30 | 71.71 | 65.86 | 76.68 | 64.88 | 59.33 | 70.54 | 0.20 | 0.17 | 0.19 | 66.94 | 62.10 | 76.67 | 72.37 | 67.11 | 77.14 | 65.48 | 60.45 | 70.89 | FAMSD | 41 | |||||||||||||||
| 42 | 3Dpro | 65.93 | 62.97 | 73.80 | 71.49 | 68.28 | 74.13 | 65.28 | 62.23 | 68.23 | 66.94 | 63.31 | 73.80 | 71.49 | 68.28 | 74.13 | 65.28 | 62.23 | 68.23 | 3Dpro | 42 | ||||||||||||||||||
| 43 | BAKER−ROBETTA | 65.93 | 58.13 | 75.53 | 71.49 | 63.01 | 76.18 | 64.48 | 56.55 | 69.77 | 0.13 | 0.13 | 0.12 | 66.13 | 58.67 | 76.52 | 71.71 | 63.60 | 77.13 | 64.88 | 57.27 | 71.18 | 0.02 | BAKER−ROBETTA | 43 | ||||||||||||||
| 44 | CpHModels | 65.73 | 59.01 | 69.57 | 71.49 | 64.18 | 72.24 | 64.68 | 58.07 | 64.52 | 65.73 | 59.01 | 69.57 | 71.49 | 64.18 | 72.24 | 64.68 | 58.07 | 64.52 | CpHModels | 44 | ||||||||||||||||||
| 45 | METATASSER | 65.52 | 61.09 | 68.77 | 71.27 | 66.45 | 69.50 | 64.48 | 59.99 | 63.91 | 76.01 | 74.26 | 79.13 | 82.24 | 80.34 | 79.86 | 74.60 | 72.75 | 73.41 | 0.53 | 0.71 | 0.24 | 0.51 | 0.70 | 0.25 | 0.53 | 0.75 | 0.27 | METATASSER | 45 | |||||||||
| 46 | Phyre_de_novo | 64.31 | 58.00 | 66.12 | 69.96 | 63.09 | 66.79 | 63.29 | 56.81 | 61.35 | 77.02 | 74.33 | 82.97 | 83.33 | 79.83 | 83.52 | 75.59 | 72.29 | 76.72 | 0.65 | 0.72 | 0.63 | 0.64 | 0.65 | 0.62 | 0.66 | 0.70 | 0.64 | Phyre_de_novo | 46 | |||||||||
| 47 | circle | 63.31 | 58.47 | 66.56 | 68.86 | 63.60 | 66.99 | 62.70 | 57.94 | 61.82 | 77.02 | 73.79 | 81.69 | 83.33 | 80.70 | 82.02 | 75.40 | 72.75 | 75.37 | 0.65 | 0.66 | 0.50 | 0.64 | 0.74 | 0.47 | 0.63 | 0.75 | 0.49 | circle | 47 | |||||||||
| 48 | Pcons_dot_net | 62.90 | 58.74 | 66.14 | 68.42 | 63.89 | 66.65 | 62.30 | 58.20 | 61.48 | 62.90 | 58.74 | 66.14 | 68.42 | 63.89 | 66.65 | 62.30 | 58.20 | 61.48 | Pcons_dot_net | 48 | ||||||||||||||||||
| 49 | Pcons_multi | 62.90 | 58.74 | 66.14 | 68.42 | 63.89 | 66.65 | 62.30 | 58.20 | 61.48 | 63.71 | 58.74 | 68.60 | 69.30 | 63.89 | 68.98 | 62.90 | 58.20 | 63.68 | Pcons_multi | 49 | ||||||||||||||||||
| 50 | nFOLD3 | 61.90 | 56.65 | 63.61 | 67.33 | 61.62 | 64.58 | 60.71 | 56.48 | 59.41 | 77.02 | 72.92 | 83.58 | 83.99 | 79.46 | 84.08 | 75.59 | 71.43 | 77.15 | 0.65 | 0.57 | 0.69 | 0.71 | 0.62 | 0.68 | 0.66 | 0.60 | 0.69 | nFOLD3 | 50 | |||||||||
| 51 | 3DShot2 | 61.69 | 57.26 | 61.61 | 67.11 | 62.28 | 62.48 | 60.71 | 56.35 | 57.50 | 61.69 | 57.26 | 61.61 | 67.11 | 62.28 | 62.48 | 60.71 | 56.35 | 57.50 | 3DShot2 | 51 | ||||||||||||||||||
| 52 | Distill | 61.69 | 56.45 | 66.62 | 66.89 | 61.18 | 67.53 | 61.51 | 57.67 | 61.99 | 65.93 | 60.69 | 71.06 | 71.05 | 64.47 | 71.69 | 64.48 | 58.60 | 65.58 | Distill | 52 | ||||||||||||||||||
| 53 | Pcons_local | 61.29 | 56.18 | 64.10 | 66.67 | 61.11 | 64.98 | 60.52 | 55.49 | 59.69 | 61.29 | 56.18 | 64.10 | 66.67 | 61.11 | 64.98 | 60.52 | 55.49 | 59.69 | Pcons_local | 53 | ||||||||||||||||||
| 54 | GeneSilicoMetaServer | 60.28 | 52.22 | 63.71 | 65.35 | 56.58 | 64.20 | 59.72 | 51.79 | 59.23 | 76.81 | 73.32 | 83.53 | 83.33 | 79.53 | 84.03 | 75.40 | 71.83 | 77.01 | 0.63 | 0.61 | 0.68 | 0.64 | 0.62 | 0.67 | 0.63 | 0.65 | 0.68 | GeneSilicoMetaServer | 54 | |||||||||
| 55 | Frankenstein | 59.88 | 51.68 | 56.78 | 65.13 | 56.21 | 57.68 | 59.33 | 51.26 | 53.19 | 59.88 | 51.68 | 64.43 | 65.13 | 56.21 | 64.74 | 59.33 | 51.26 | 59.80 | Frankenstein | 55 | ||||||||||||||||||
| 56 | GS−MetaServer2 | 53.23 | 47.45 | 53.91 | 57.90 | 51.61 | 54.78 | 52.58 | 46.89 | 50.57 | 53.23 | 47.45 | 53.91 | 57.90 | 51.61 | 54.78 | 52.58 | 46.89 | 50.57 | GS−MetaServer2 | 56 | ||||||||||||||||||
| 57 | forecast | 52.62 | 44.96 | 53.80 | 57.24 | 48.90 | 54.69 | 52.38 | 44.71 | 51.05 | 59.07 | 55.17 | 61.77 | 64.25 | 60.02 | 62.67 | 58.13 | 54.30 | 57.47 | forecast | 57 | ||||||||||||||||||
| 58 | 3D−JIGSAW_AEP | 51.41 | 46.44 | 52.34 | 55.92 | 51.53 | 53.60 | 51.59 | 47.49 | 49.43 | 52.02 | 49.19 | 52.62 | 56.58 | 53.51 | 53.62 | 51.79 | 48.28 | 49.43 | 3D−JIGSAW_AEP | 58 | ||||||||||||||||||
| 59 | ACOMPMOD | 50.40 | 45.97 | 46.04 | 54.83 | 50.00 | 47.08 | 49.60 | 45.24 | 43.73 | 55.24 | 51.08 | 51.38 | 60.09 | 55.56 | 52.40 | 54.37 | 50.13 | 48.41 | ACOMPMOD | 59 | ||||||||||||||||||
| 60 | MUFOLD−Server | 48.59 | 40.79 | 47.11 | 52.85 | 44.37 | 48.37 | 48.61 | 40.28 | 44.23 | 48.59 | 41.26 | 47.27 | 52.85 | 44.66 | 48.61 | 48.61 | 40.87 | 44.50 | MUFOLD−Server | 60 | ||||||||||||||||||
| 61 | panther_server | 47.58 | 42.47 | 50.35 | 51.75 | 46.20 | 51.05 | 46.83 | 41.80 | 47.32 | 53.43 | 49.26 | 51.02 | 58.11 | 53.58 | 51.72 | 52.58 | 49.41 | 48.04 | panther_server | 61 | ||||||||||||||||||
| 62 | FOLDpro | 44.56 | 34.61 | 41.07 | 48.03 | 41.16 | 41.74 | 43.45 | 38.43 | 38.72 | 52.02 | 44.76 | 51.19 | 56.36 | 48.47 | 51.88 | 50.99 | 43.85 | 47.85 | FOLDpro | 62 | ||||||||||||||||||
| 63 | rehtnap | 41.13 | 36.29 | 39.96 | 44.74 | 39.47 | 40.74 | 40.48 | 35.32 | 37.78 | 41.13 | 36.29 | 39.96 | 44.74 | 39.47 | 40.74 | 40.48 | 35.32 | 37.78 | rehtnap | 63 | ||||||||||||||||||
| 64 | MUFOLD−MD | 21.17 | 18.35 | 28.55 | 22.81 | 19.74 | 29.52 | 20.44 | 17.66 | 27.52 | 21.17 | 18.35 | 29.41 | 22.81 | 19.74 | 30.12 | 20.44 | 17.66 | 28.84 | MUFOLD−MD | 64 | ||||||||||||||||||
| 65 | RBO−Proteus | 17.34 | 16.13 | 26.38 | 18.86 | 17.54 | 27.19 | 17.06 | 15.87 | 25.89 | 20.77 | 19.56 | 26.84 | 22.37 | 21.05 | 27.43 | 23.02 | 21.82 | 26.16 | RBO−Proteus | 65 | ||||||||||||||||||
| 66 | mariner1 | 14.72 | 12.70 | 17.21 | 16.01 | 13.82 | 20.14 | 14.48 | 12.50 | 17.34 | 55.85 | 44.56 | 61.92 | 60.53 | 48.83 | 62.71 | 54.56 | 44.58 | 57.62 | mariner1 | 66 | ||||||||||||||||||
| 67 | mahmood−torda−server | 13.71 | 11.29 | 16.59 | 14.47 | 9.50 | 17.93 | 13.89 | 10.58 | 16.98 | 13.91 | 11.56 | 18.71 | 15.13 | 12.35 | 19.97 | 13.89 | 11.64 | 18.54 | mahmood−torda−server | 67 | ||||||||||||||||||
| 68 | RANDOM | 13.38 | 11.41 | 13.38 | 15.01 | 12.67 | 15.01 | 14.36 | 12.03 | 14.36 | 13.38 | 11.41 | 13.38 | 15.01 | 12.67 | 15.01 | 14.36 | 12.03 | 14.36 | RANDOM | 68 | ||||||||||||||||||
| 69 | OLGAFS | 11.89 | 10.42 | 4.78 | 12.94 | 11.11 | 6.96 | 11.90 | 9.46 | 6.27 | 11.89 | 10.55 | 6.37 | 13.16 | 11.40 | 9.35 | 12.10 | 10.12 | 7.57 | OLGAFS | 69 | ||||||||||||||||||
| 70 | huber−torda−server | 11.09 | 9.61 | 5.85 | 12.06 | 10.45 | 8.20 | 11.31 | 9.85 | 7.45 | 64.31 | 59.74 | 69.85 | 69.96 | 64.98 | 71.88 | 63.29 | 58.53 | 64.79 | huber−torda−server | 70 | ||||||||||||||||||
| 71 | schenk−torda−server | 11.09 | 9.41 | 14.28 | 11.84 | 10.31 | 14.95 | 11.31 | 10.52 | 14.71 | 15.12 | 13.37 | 15.98 | 16.45 | 14.55 | 16.93 | 14.88 | 13.56 | 16.59 | schenk−torda−server | 71 | ||||||||||||||||||
| 72 | BHAGEERATH | BHAGEERATH | 72 | ||||||||||||||||||||||||||||||||||||
| 73 | Fiser−M4T | Fiser−M4T | 73 | ||||||||||||||||||||||||||||||||||||
| 74 | test_http_server_01 | test_http_server_01 | 74 | ||||||||||||||||||||||||||||||||||||