Random model to compute random scores
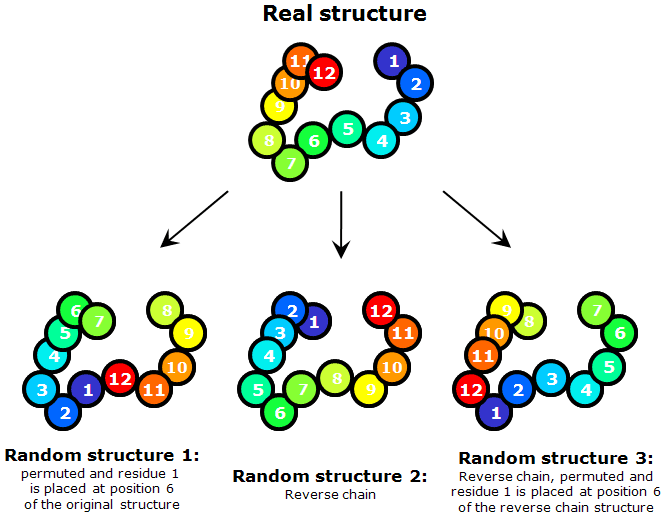
To judge about the quality of predictions, it is important to have a model for random comparison. The model we use takes a target structure into account. We modify the target structure by circularly permuting it and shifting (threading) a sequence along the chain with a step of 5 residues. I.e. for a target of n residues, amino acid 1 is placed at the site 6, 2 at the site 7, i (1 ≤ i ≤ n-5) at the site i+5, and n-j (0 ≤ j < 5) at the site 5-j. For a chain of n residues, [integer part of n/5-1] such modified structures are made.
Each of these modified structures is compared to the original structure to compute a score. Since coordinates of the structure are not modified in this process and only sequence is assigned to given coordinates differently, our procedure does not give a meaningful random comparison for all types of scores, e.g. DALI Z would be highly elevated for a random score if computed on this model. However, GDT-TS, TR and CS scores we use in our evaluation behave as expected and this "permutation-shift" random model works well for them.
Additionally, we increase the number and diversity of these random comparisons by considering a "reverse chain" model, when the sequence is threaded onto the structure from C- to N-terminus and sequence shifts along the chain are made. More specifically, amino acid 1 is placed at the site n, 2 at the site n-1, and i at the site n-i+1. This forms one of the "random" structures. Then shifts with permutations are made to it as described above and we obtain [integer part of n/5] structures.

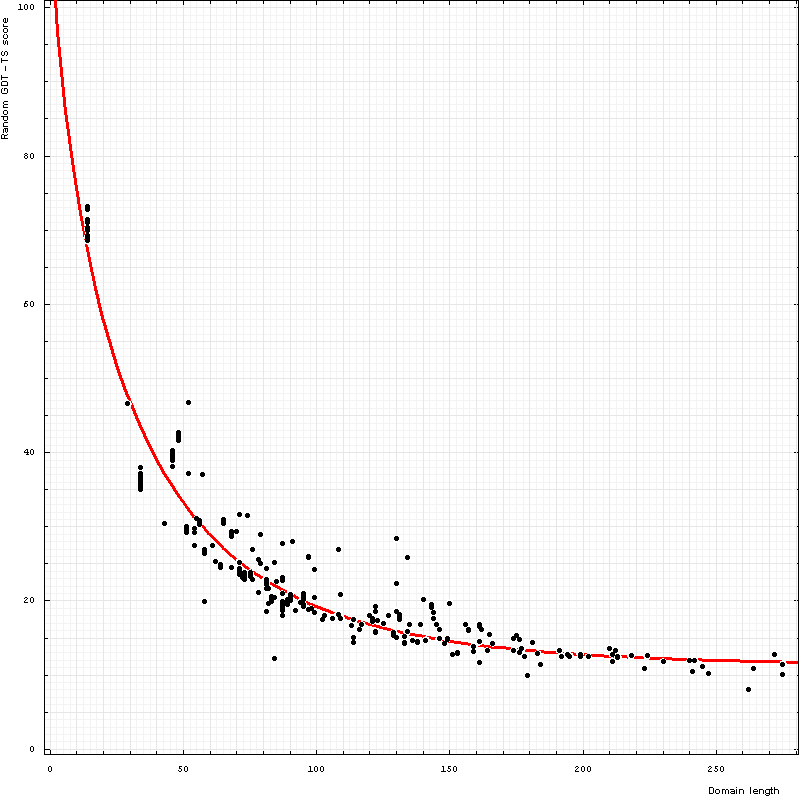
Random scores show strong reverse correlation with length. Random GDT-TS scores can be well-fitted with a function a Exp( b Lengthc) − a Exp( b 2c) + 100, where the best fit parameter values are a = 102.814, b = 0.089 and c = 0.729:

Dependence of GDT-TS (vertical axis) on domain length (horizontal axis). Each point represents a random score for a domain. All NMR models for each domain
are used, and random scores for them appear as vertical streaks giving an idea about random errors of random scores. Red curve is the best-fit of the function
RandomScore = a Exp(b Lengthc) − a Exp(b 2c) + 100 to the points:
RandomScore = 102.8 Exp(-0.089 Length0.729) + 11.3
This function is designed to give random score of 100 for Length=2, i.e. for a protein of 2 residues any random superposition will lead to a perfect match. For Length → ∞, random score approaches a value larger than 0. Using the following function one can estimate random GDT-TS score for a domain of 'Length' residues:
RandomScore = 102.8 Exp(−0.089 Length 0.729) + 11.3
In addition to giving a reference point for prediction of difficult targets, these random scores are utilized when a server does not have a model for a particular target. A difficulty arises when we need to compute a sum of scores for all targets for a given server in case some scores are negative and some targets were not predicted. If a certain type of score can only be positive, missing predictions contribute 0 to the total score and this seems reasonable. However, for Z-scores, poor predictions get negative scores. Thus if missing predictions are assigned a score 0, it may happen that a server not submitting predictions for some targets will do better than a server submitting less than average predictions (with negative Z-scores). One way to handle this would be to omit all negative scores from summation, as has been done in former years of assessment. However, with improved quality of models, it seems reasonable that negative Z-scores should penalize a server. Thus we use negative scores in summation. However, we replace missing models with random Z-scores computed according to this method. So, not submitting a prediction is equivalent to submitting a "random" prediction in our assessment.
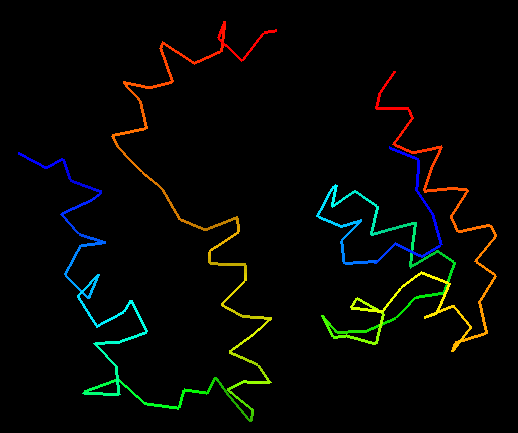
Interestingly, some servers submitted predictions of inferior quality than random predictions. Although this seems a bit counter intuitive, it makes sense when the model is inspected. Such worse-than-random predictions are much less compact than real proteins, and this, taking a random protein with similar secondary structure composition and length to the target, will result in better score. Here is one example of a prediction that is worse than random:

T0473 structure on the right and worse-than-random prediction on the left:
random GDT-TS of 29% vs. GDT-TS of 25% for the prediction.