Scores we used for evaluation of predictions
Having a good score to evaluate predictions is crucial for method development. Since many approaches are trained to produce models scoring better according to some evaluation method, flaws in the evaluation method will result in better-scoring models that will not represent real protein structure in any better way. One of such dangers is compression of coordinates, which decreases the gyration radius and may increase some scores based on Cartesian superpositions. Assessment of predictions by experts, as done in CASP, is essential to detect such problems.
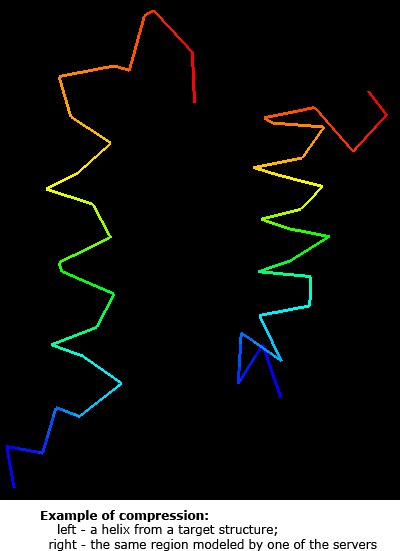
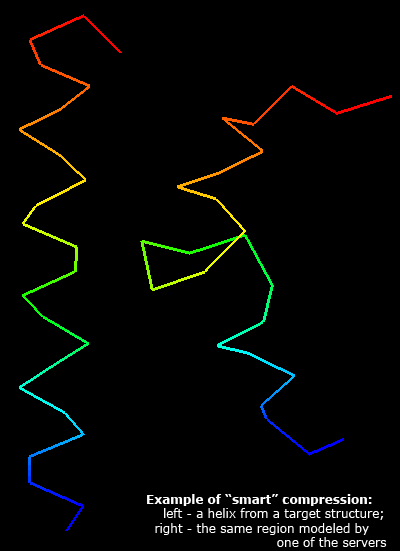
Nevertheless, it is desirable to come up with a good automatic approach that gives evaluation scores in agreement with expert judgment. On the CASP5 material, we found 1) that the average of Z-scores computed on sever model samples for many different scoring systems correlates best with expert, manual assessment. These scoring systems should represent different concepts of measuring similarity, such as Cartesian superpositions, intramolecular distances and sequence alignments. Among various scores that have been suggested, it seems 1) that GTD–TS score computed by LGA program 2) is best as a single score to reflect the model quality. This is probably because GTD–TS score is a combination of 4 scores, each computed on a different superposition (1, 2, 4, and 8Å). However, GTD–TS score scales with the gyration radius and is influenced by compression. We analyzed server predictions using three scoring systems: the classic LGA GTD–TS, and two novel scores.
1) As a cornerstone of this evaluation, we computed GTD–TS scores for all server models using LGA program 2). This score represents a standard in the field, it is always shown first, and score tables are sorted by it by default. We call this score TS, i.e. 'total score', for short.
2) GTD–TS score measures the fraction of residues in a model within a certain distance from the same residues in the structure after a superposition. This approach is based on a "reward". Each residue placed in a model close to its "real" position in the structure is rewarded, and the reward depends on how close that modeled residue is. Taking an analogy with physical forces, such a score is only the "attraction" part of a potential, and there is no "repulsion" component in GDT–TS. It might have been reasonable a few years ago, when predictions were quite poor. It was important to detect any positive feature of a model, since there were more negatives about a model than positives. Today, many models reflect structures well. When the positives start to outweigh the negatives, it becomes important to pay attention to the negatives. Thus we introduced a "repulsion" component into the GDT–TS score. When a residue is close to its "correct" residue, GDT–TS rewards it, and if a residue is too close to "incorrect" residues (other than the residue that is modeled), we subtract a penalty from the GDT–TS score. This idea was suggested by David Baker as a part of our collaboration on CASP and model improvement. We call the score Ruslan Sadreyev and ShuoYong Shi developed in the Grishin Lab based on this idea TR, i.e. 'the repulsion'. TR score, in addition to rewarding for close superposition of corresponding model and target residues, penalizes for close placement of other residues. This score is calculated as follows.
- Superimpose model with target using LGA in the sequence-dependent mode, maximizing the number of aligned residue pairs within d=4Å.
- For each aligned residue pair, calculate a GDT–TS - like score: S0(R1, R2) = 1/4 [N(1)+N(2)+N(4)+N(8)], where N(r) is the number of superimposed residue pairs with the CA–CA distance < r Å.
- Consider individual aligned residues in both structures. For each residue R, choose residues in the other structure that are spatially close to R, excluding the residue aligned with R and its immediate neighbors in the chain. Count numbers of such residues with CA-CA distance to R within cutoffs of 1, 2, and 4Å. (As opposed to GDT–TS, we do not use the cutoff of 8Å as too inclusive).
- The average of these counts defines the penalty assigned to a given residue R: P(R) = 1/3 * [N(1) + N(2) + N(4)]
- Finally, for each aligned residue pair (R1, R2), the average of penalties for each residue P(R1, R2) = 1/2 * (P(R1) + P(R2)) is weighted and subtracted from the GDT–TS score for this pair. The final score is prohibited from being negative: S(R1, R2) = max[ S0(R1, R2)-w*P(R1, R2), 0 ]
Among tested values of weight w, we found that w=1.0 produced the scores that were most consistent with the evaluation of model abnormalities by human experts.
3) Scores comparing intramolecular distances between a model and a structure (contact scores) have different properties than intermolecular distance scores based on optimal superposition. One advantage of such scores is that superpositions, and thus arguments about their optimality, are not involved. Contact matrix scores are used by one of the best structure similarity search program DALI. The problems with developing a good a contact score are 1) contact definition; 2) mathematical expressions converting distance differences to scores. Jing Tong will describe her procedure in details. Briefly, contact between residues is defined by a distance ≤8.44Å between their Cα atoms. The difference between such distances in a model and a structure is computed and used as a fraction of the distance in the structure. Fractional distances above 1 (distance difference above the distance itself) are discarded and exponential is used to convert distances to scores (0→1). The factor in the exponent is chosen to maximize the correlation between contact scores and GDT–TS scores. These residue pair scores are averaged over all pairs of contacting residues. We call this score CS, i.e. 'contact score', for short. Should not be confused with a general abbreviation for a "column score" used in sequence alignments.
We studied correlation between GDT–TS and two new scores: TR and CS. For each domain, top 10 scores for the first server models were averaged and used to represent a score for a domain. These averages are plotted below for TS and TR scores:
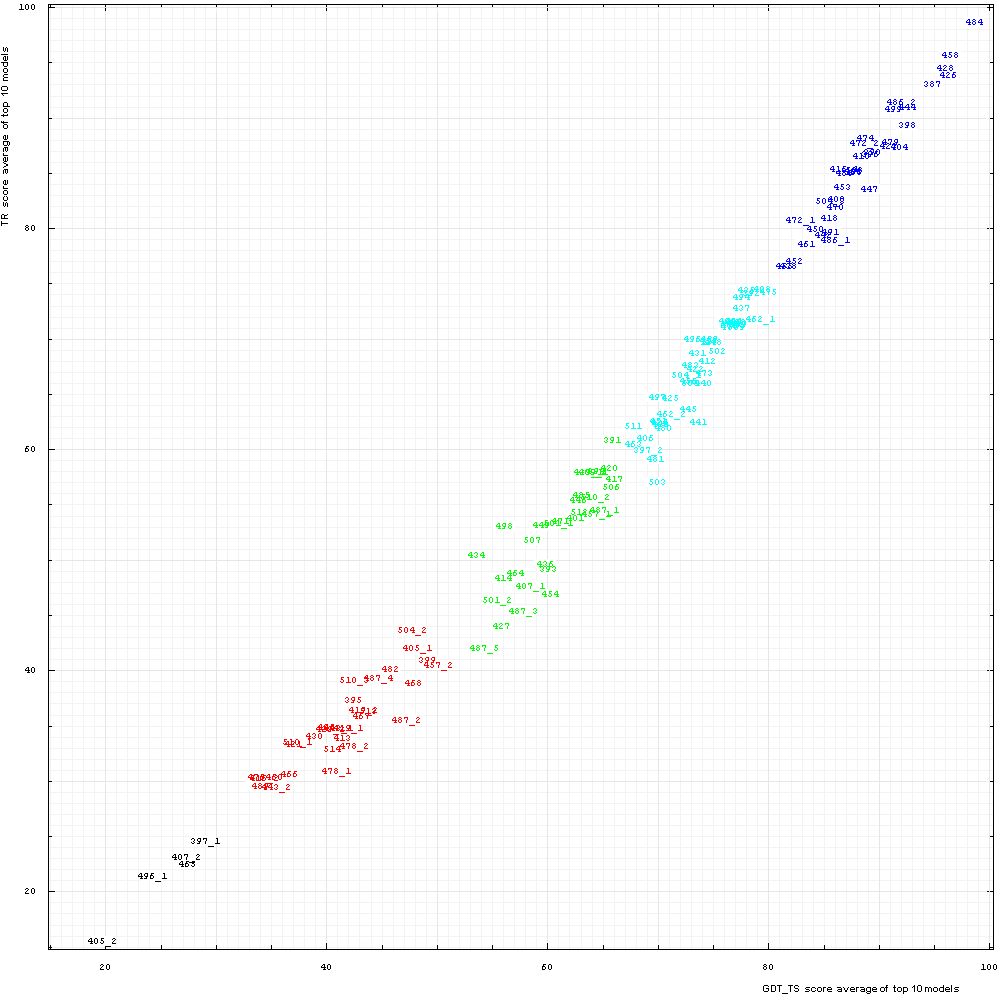
Correlation between TR score (vertical axis) and GDT-TS (horizontal axis). Scores for top 10 first server models were averaged for each domain
shown by its number positioned at a point with the coordinates equal to these averaged scores.
Domain numbers are colored according to the difficulty category suggested by our
analysis: black - FM (free modeling); red - FR (fold recognition); green - CM_H (comparative modeling: hard); cyan - CM_M
(comparative modeling: medium); blue - CM_E (comparative modeling: easy).
It is clear that TS and TR scores are well correlated, with Pearson correlation coefficient equal to 0.991. Since TR is TS minus penalty, TR is always lower that TS. Moreover, the trendcurve of the correlation is concave, so TR are more different from TS around the mid-range. where models become less similar to structures and modeled residues are frequently placed nearby non-equivalent residues resulting in higher penalty. For very low model quality (TS below 30%) there is not much reward, so penalty drops as well.
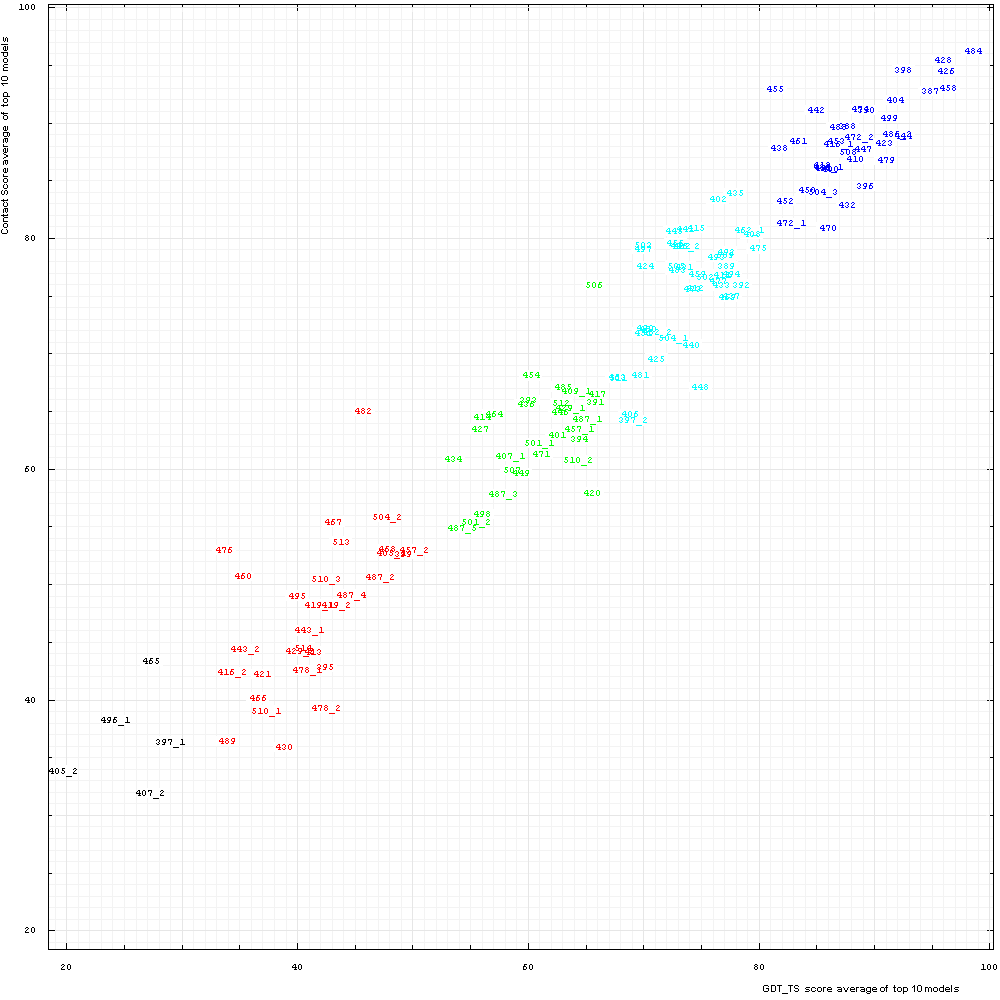
Correlation between Contact score CS (vertical axis) and GDT-TS (horizontal axis). Scores for top 10 first server models were averaged for each domain
shown by its number positioned at a point with the coordinates equal to these averaged scores.
Domain numbers are colored according to the difficulty category suggested by our
analysis: black - FM (free modeling); red - FR (fold recognition); green - CM_H (comparative modeling: hard); cyan - CM_M
(comparative modeling: medium); blue - CM_E (comparative modeling: easy).
Apparently, TS and CS scores are correlated but less than TS and TR scores. Pearson correlation coefficient is 0.969. Nevertheless, this correlation is very good, provided that TS is based on superpostions, but CS is superposition-independent contact-based score.
To illustrate 1) similarity between scores and 2) individual flavors of each score, we show changes in ranking on all targets in domains and on FR (fold recognition) domains.
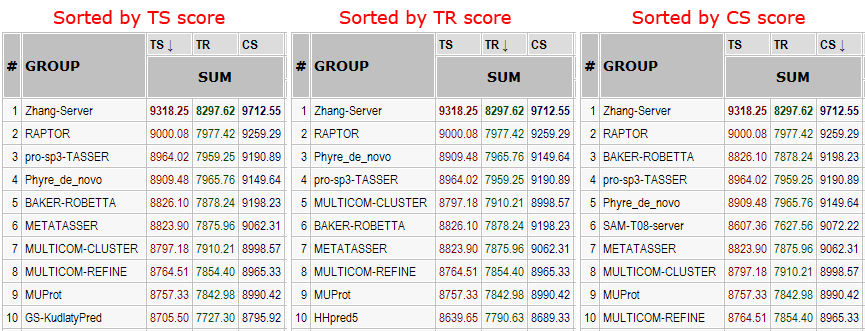
Server rankings on all targets in domains for three scores. On all 143 domains, ranking does not change much with score, illustrating that
1) scores correlate with each other and
2) the ranking is robust.
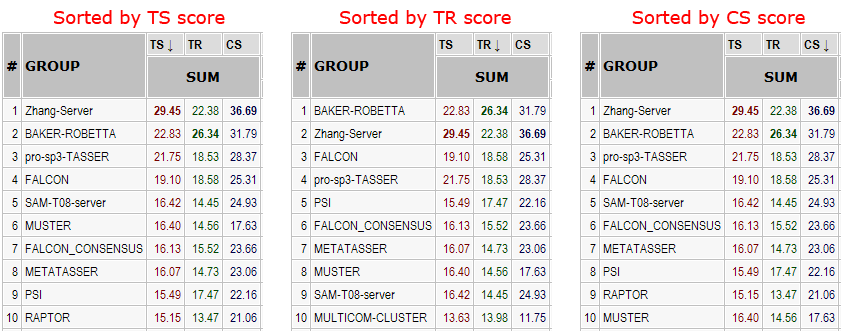
Server rankings on FR domains for three Z-scores. On 28 FR domains, ranking shows small variations illustrating the differences between individual scores and between servers.
1) L.N.Kinch, J.O.Wrabl, S.S.Krishna, I.Majumdar, R.I.Sadreyev, Y.Qi, J.Pei, H.Cheng, and N.V.Grishin (2003) "CASP5 Assessment of Fold Recognition Target Predictions". Proteins 53(S6): 395-409 PMID: 14579328
2) Zemla A. (2003) "LGA: A method for finding 3D similarities in protein structures." Nucleic Acids Research 31(13): 3370-3374 PMID: 12824330