Whole chain vs. Domain in CASP
Traditionally, CASP targets are evaluated as domains, i.e. each target structure is parsed into domains, and model quality is computed for each domain separately. This strategy makes sense for two reasons:
- Domains can be mobile and their relative packing can be influenced by ligand presence, crystal packing for X-ray structures, or be semi-random in NMR structures. Thus even a perfect prediction algorithm will not be able to cope with this adequately, for instance in the absence of knowledge about the ligand presence or crystal symmetry.
- Predictions may be better or worse for individual domains than for their assembly. This happens when domains are of a different predictability, e.g. one has a close template, but the other one does not. Even if domains of a target are of equal prediction difficulty, it is possible that the mutual domain arrangement in the target structure, while predictable in principle, differs from the template, and thus is modeled incorrectly by predictors.
Comparison of the whole-chain evaluation with the domain-based evaluation dissects the problem of 'individual domain' vs. 'domain assembly' modeling and should help in development of prediction methods.
While it is clear that a detailed look at the predictions for each domain is beneficial, it is desirable to combine predictions over targets in a meaningful way, and to rank servers by the averaged ability to predict protein structures. Combination over whole chains does not address problems with domain predictions, but combination over domains may be dominated by multi-domain easy targets with domain arrangement matching the template and thus predicted well. Therefore it makes sense to combine whole chain and domain evaluations. In this combination, some targets, in particular those without problems of domain assembly, could be evaluated as 'whole chain'; while other targets, notably those with different domain predictability or difficulties with domain assembly, could be evaluated as 'domains'. Here, we attempted to determine a natural cutoff for whether the target should be evaluated as a 'domains' or as a 'whole chain'.
For each target composed of more than 1 domain (see our domain parse), we obtained GDT-TS scores on the whole chain and individual domains for all server models. Then weighted sum of GDT-TS scores for domain-based evaluation was computed, i.e. GDT-TS for each domain was multiplied by the domain length, summed, and the sum was divided by the sum of domain lengths. Typical correlation plot between the two GDT-TSs (whole chain and weighted by the number of residues sum of GDT-TS scores for domain-based evaluation) looked like this:
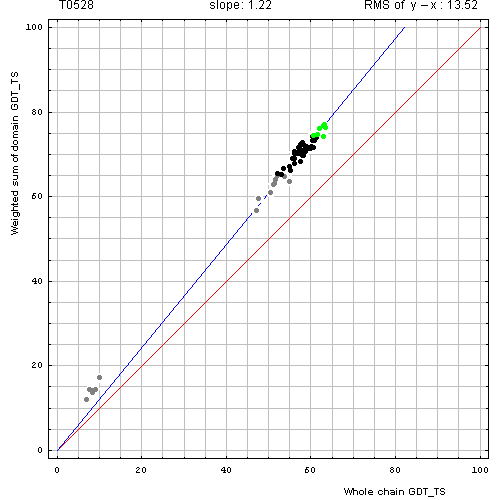
Correlation between weighted by the number of residues sum of GDT-TS scores for domain-based
evaluation (y, vertical axis)
and whole chain GDT-TS (x, horizontal axis).
Each point represents first server model. Green, gray and black points are top 10, bottom 25% and the rest of prediction models. Blue line is the best-fit slope line (intersection 0) to the top 10 server models. Red line is the diagonal. Slope and root mean square y-x distance for the top 10 models (average difference between the weighted sum of domain GDT-TS scores and the whole chain GDT-TS score) are shown above the plot.
The points lie above the diagonal. Apparently, weighted sum of domain predictions is higher than the whole chain GDT-TS. This is because domain arrangement is a bit different between target and template, thus, while individual domains are modeled well, their assembly is predicted worse. We measure the difference between the weighted sum and the whole chain GDT-TS by two parameters. The root mean square (RMS) difference between the weighted sum of GDT_TS on domains and GDT_TS on the whole chain (RMS of y−x) measures absolute GDT-TS difference. A slope of best-fit line with intercept set to 0 (slope) measures relative GDT-TS difference. These parameters are computed on top 10 (according to the weighted sum) predictions.
The target on the above plot (T0528) is a three-domain protein. The slope and the RMS of y−x are 1.22 and 13.52, respectively. Do these parameters justify splitting the target into 2 domains and using all the domain individually in the combined evaluation of predictions? To answer this question, we examined correlation plots for all targets.
Here, we illustrate two examples. First, for T0521, which is a two domain protein, the plot revealed that while individual domains are predicted reasonably well: GDT-TS above 80 for some servers, their packing was not: GDT-TS about 40, which is 2 times less than the weighted sum over 2 domains, thus indicating that domain arrangement was modeled randomly by the servers and did not match closely the target domain arrangement. Obviously, domain evaluation is beneficial for this target.
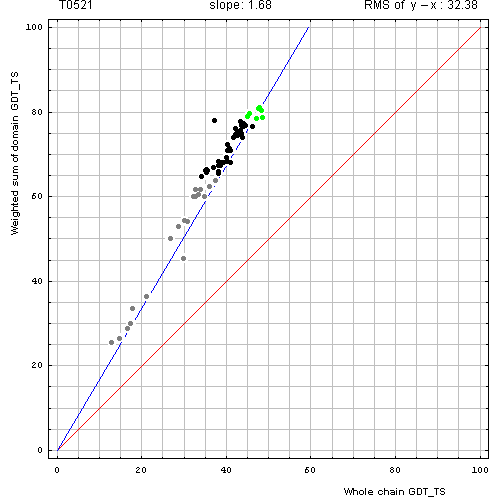
Correlation between weighted by the number of residues sum of GDT-TS scores for domain-based
evaluation (y, vertical axis)
and whole chain GDT-TS (x, horizontal axis).
Second, for T0515, which is also a 2-domain target, the plot revealed that weighted sum and whole chain GDT-TS are about the same for all servers. Clearly, domain-based evaluation is not different from the whole chain evaluation and does not reveal any interesting features of predictions.
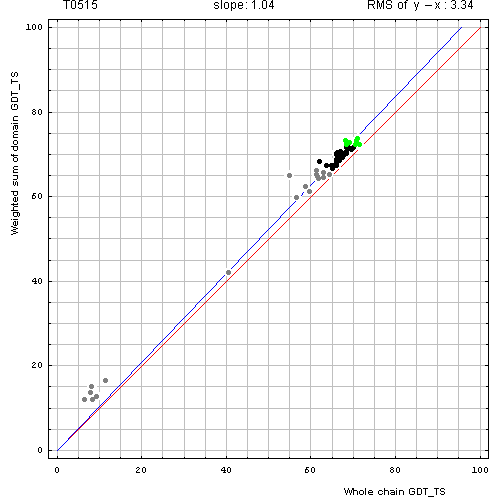
Correlation between weighted by the number of residues sum of GDT-TS scores for domain-based
evaluation (y, vertical axis)
and whole chain GDT-TS (x, horizontal axis).
Before we examine all targets to find a data-dictated cutoff for domain-based evaluation, additional issue needs to be considered. Some proteins, while being evolutionarily single-domain proteins, experience domain swaps. Domain swap is defined as a structural "exchange" of protein regions between monomers in an oligomer. For instance, T0459 is a PYP-like sensor domain with 'domain swap'. See diagram below, the left panel shows the whole chain, and the right illustrats the swap:

Here is the correlation between domain-based evaluation and whole-chain based evaluation for T0600. And clearly, domain-based evaluation (evaluation on domain swap) is needed for T0600.
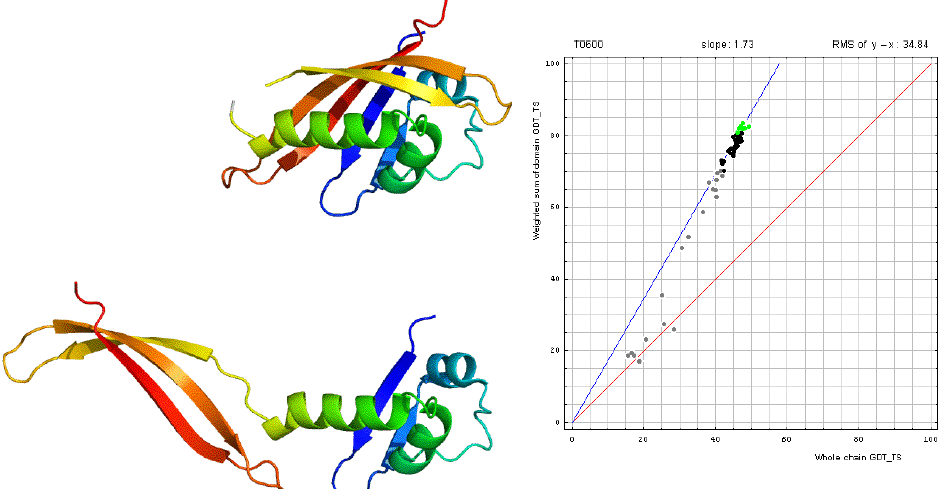
To find a cutoff for using 'domain-based' vs. 'whole chain' evaluation, we analyzed the correlation of RMS of the difference between GDT_TS on domains and GDT_TS on the whole chain (RMS of y−x) and the slope of the 0 intercept best-fit line (slope) for all targets:
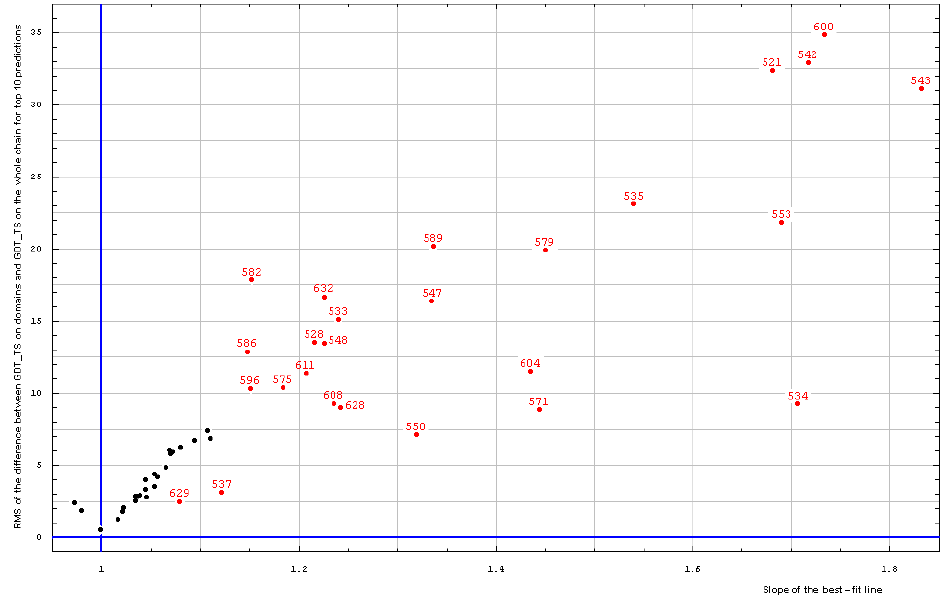
All targets:
Correlation between RMS of the difference between GDT_TS on domains and GDT_TS on the whole chain (vertical axis)
and the slope of the best-fit line (horizontal axis), both computed on top 10 server predictions.
it shows that the reasonable cutoff is: RMS > 7.5 and slope > 1.125
Summary: Comparison of domain-based predictions with whole chain predictions revealed a natural, data-dictated cutoff (slope of the zero intercept best-fit line is above 1.3) to select targets that
require domain-based evaluation. These targets are:
T0521, T0528,
T0529, T0533,
T0534, T0542,
T0543, T0544,
T0547, T0548,
T0550, T0553,
T0555, T0571,
T0575, T0579,
T0582, T0586,
T0589, T0596,
T0600, T0604,
T0608, T0611,
T0628, T0629,
T0632.
Predictions for other targets follow the general trend, are of a more similar quality for 'domain' and 'whole chain' and thus domain-based evaluation
may not be necessary for them. It is important to note that this cutoff was found using CASP9 targets and predictions. It is possible, even likely, that for other target/prediction sets, data may dictate a different cutoff.
Therefore similar analysis should be performed on other target sets, rather that this 1.3 slope cutoff being applied to them.
We used only the "red" targets in domain evaluation to combine scores between targets, thus only these targets are split into domains in combined evaluation tables. All other targets were evaluated as whole chain in domain-based evaluation: they are considered to be single-domain targets for the purpose of CASP9 evaluation. However, all domain-based evaluation results for all targets are shown on individual target pages and are available for analysis and model visualization with PyMOL, e.g. see T0515. These "domains" include single domain proteins with certain structure regions removed, and swapped domains.